Interface
Below you will find details and descriptions of how to use the features of the Forestry Catchment Planner application interface.
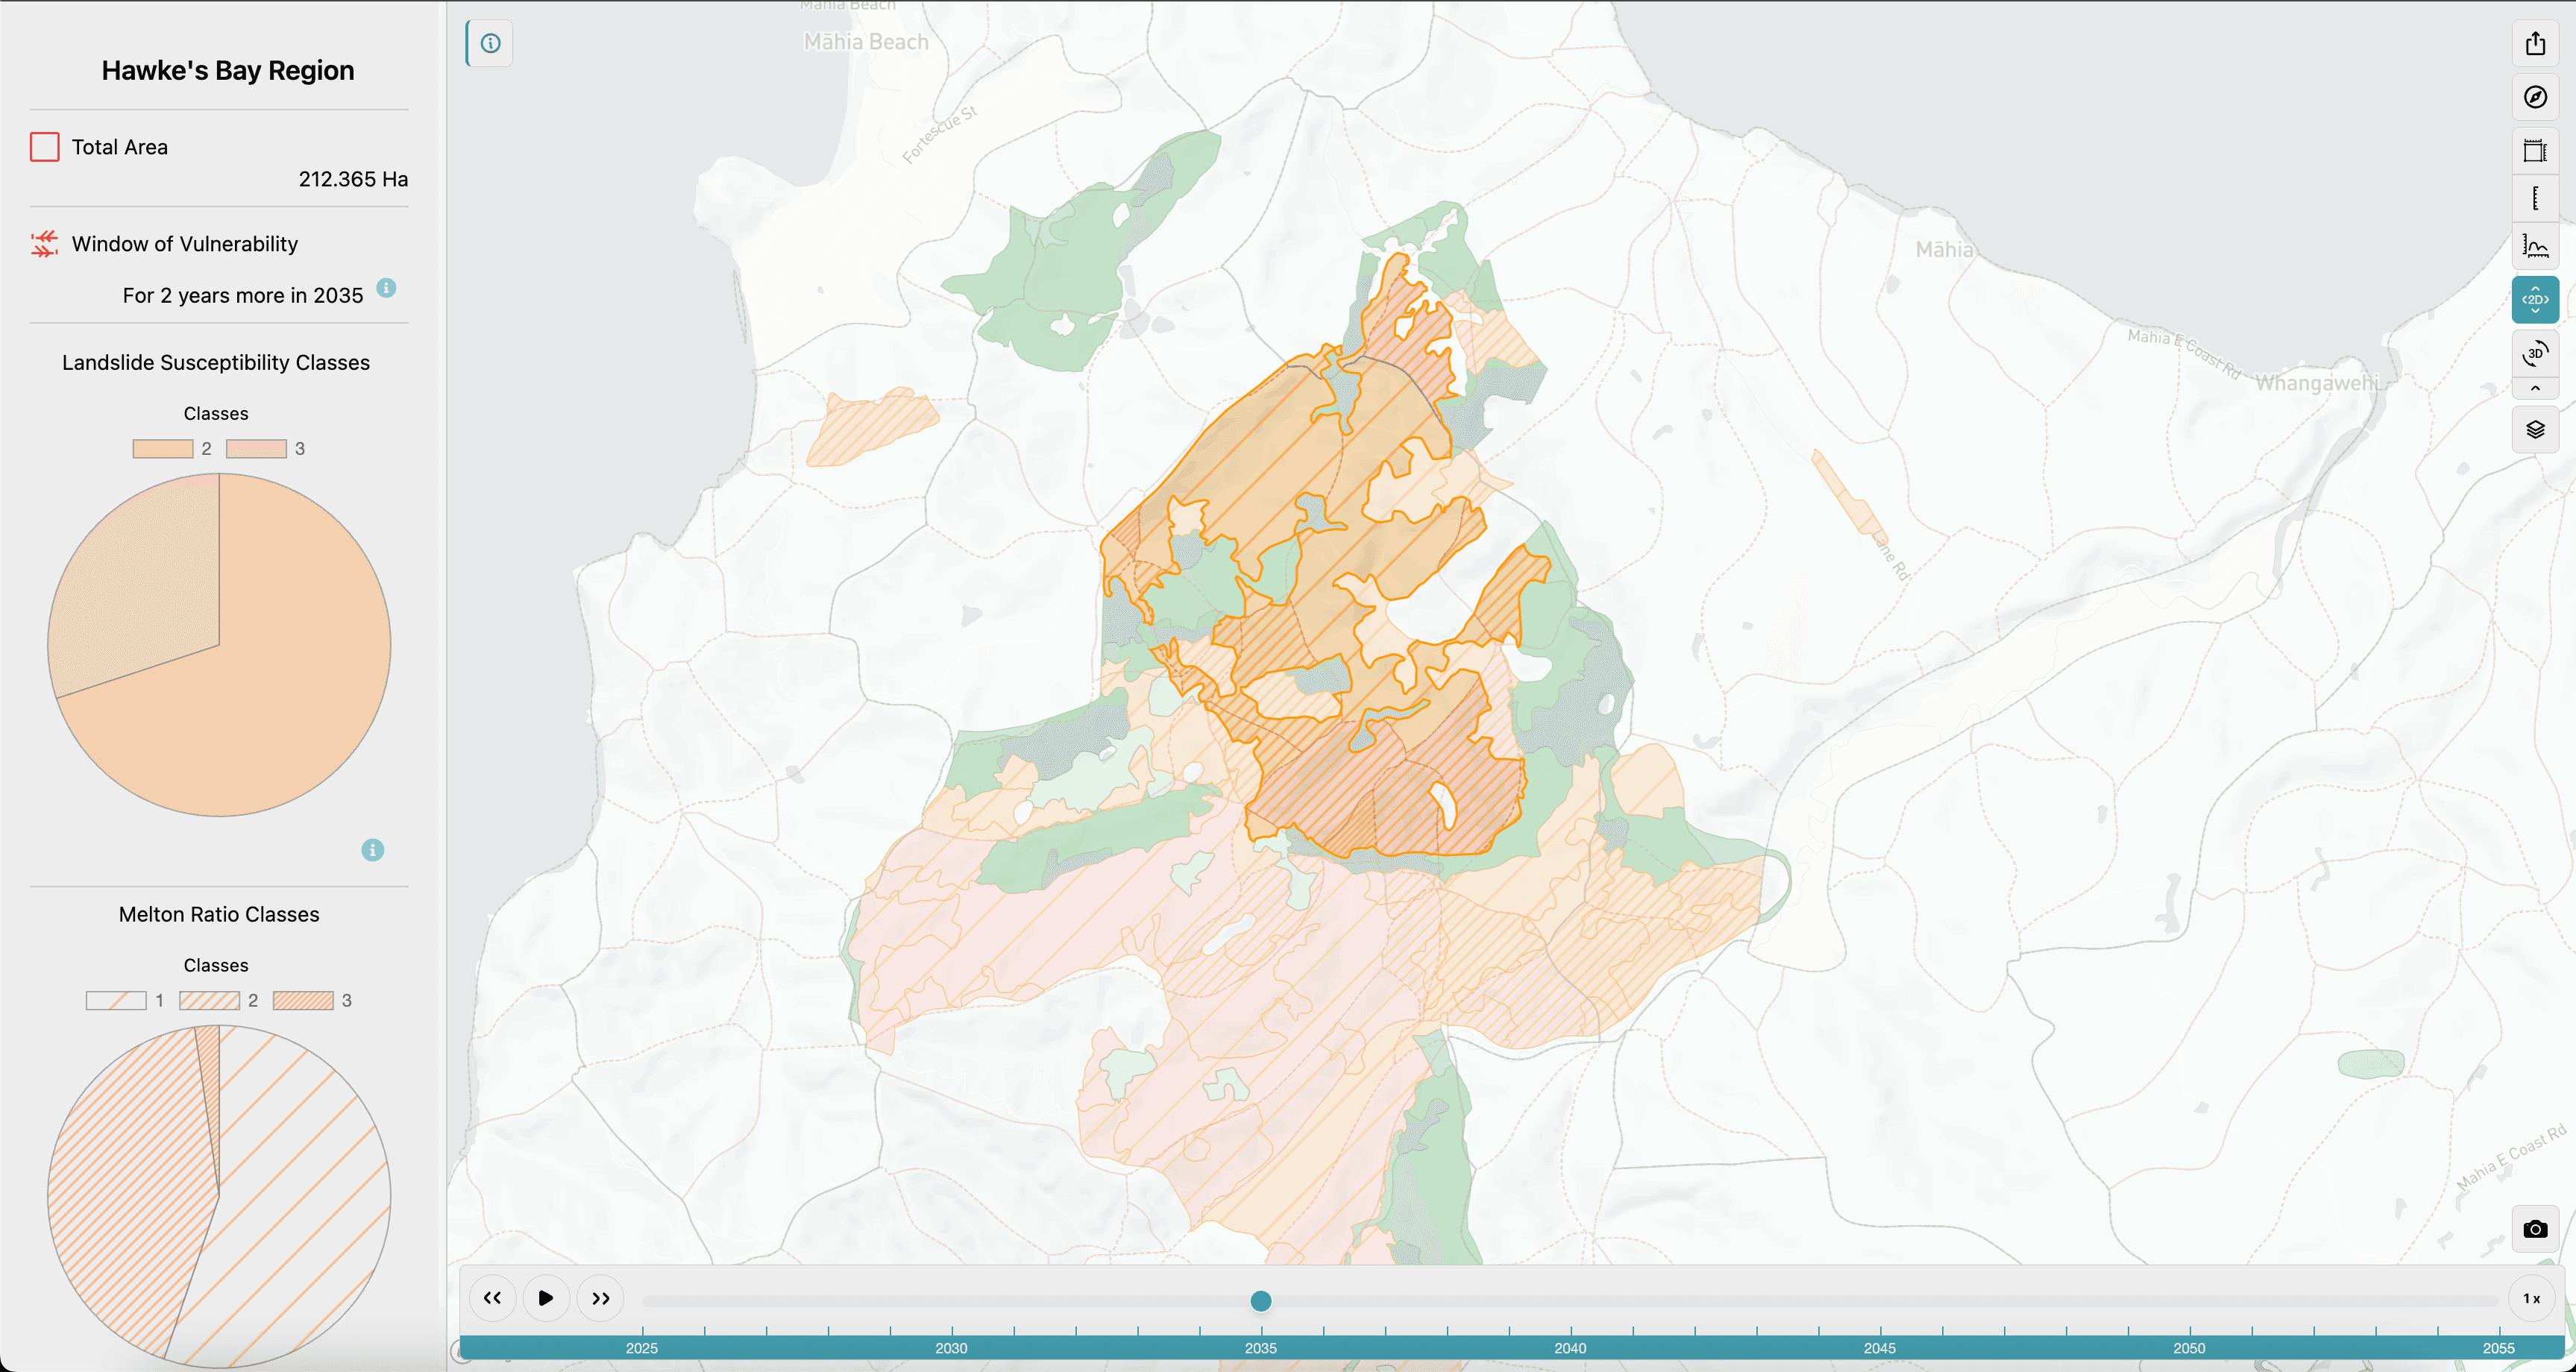
Time-Slider
The Time-slider gives the ability to visualise where forest harvesting is likely to take place based on the stand age and estimated harvest period.
- Users can play the time slider in a loop.
- Increase the speed of the animation.
- Step back and forth through each year.
- Drag the point of time back and forth to view change over time.
Sharing
The Share tool gives the ability to quickly share with other users the map view you’re looking at, the selection you’ve made and the layers that are turned on at the time. For example, you can:
- Zoom to a location, click a catchment, toggle on the 3D mode and rotate the map to set the orientation.
- You can then toggle on different layers and change the basemap to help illustrate what you want to show.
- Simply click the share button which copies the link to the clipboard, paste and send to someone.
- Clicking the link will immediately snap the user to the view you shared.
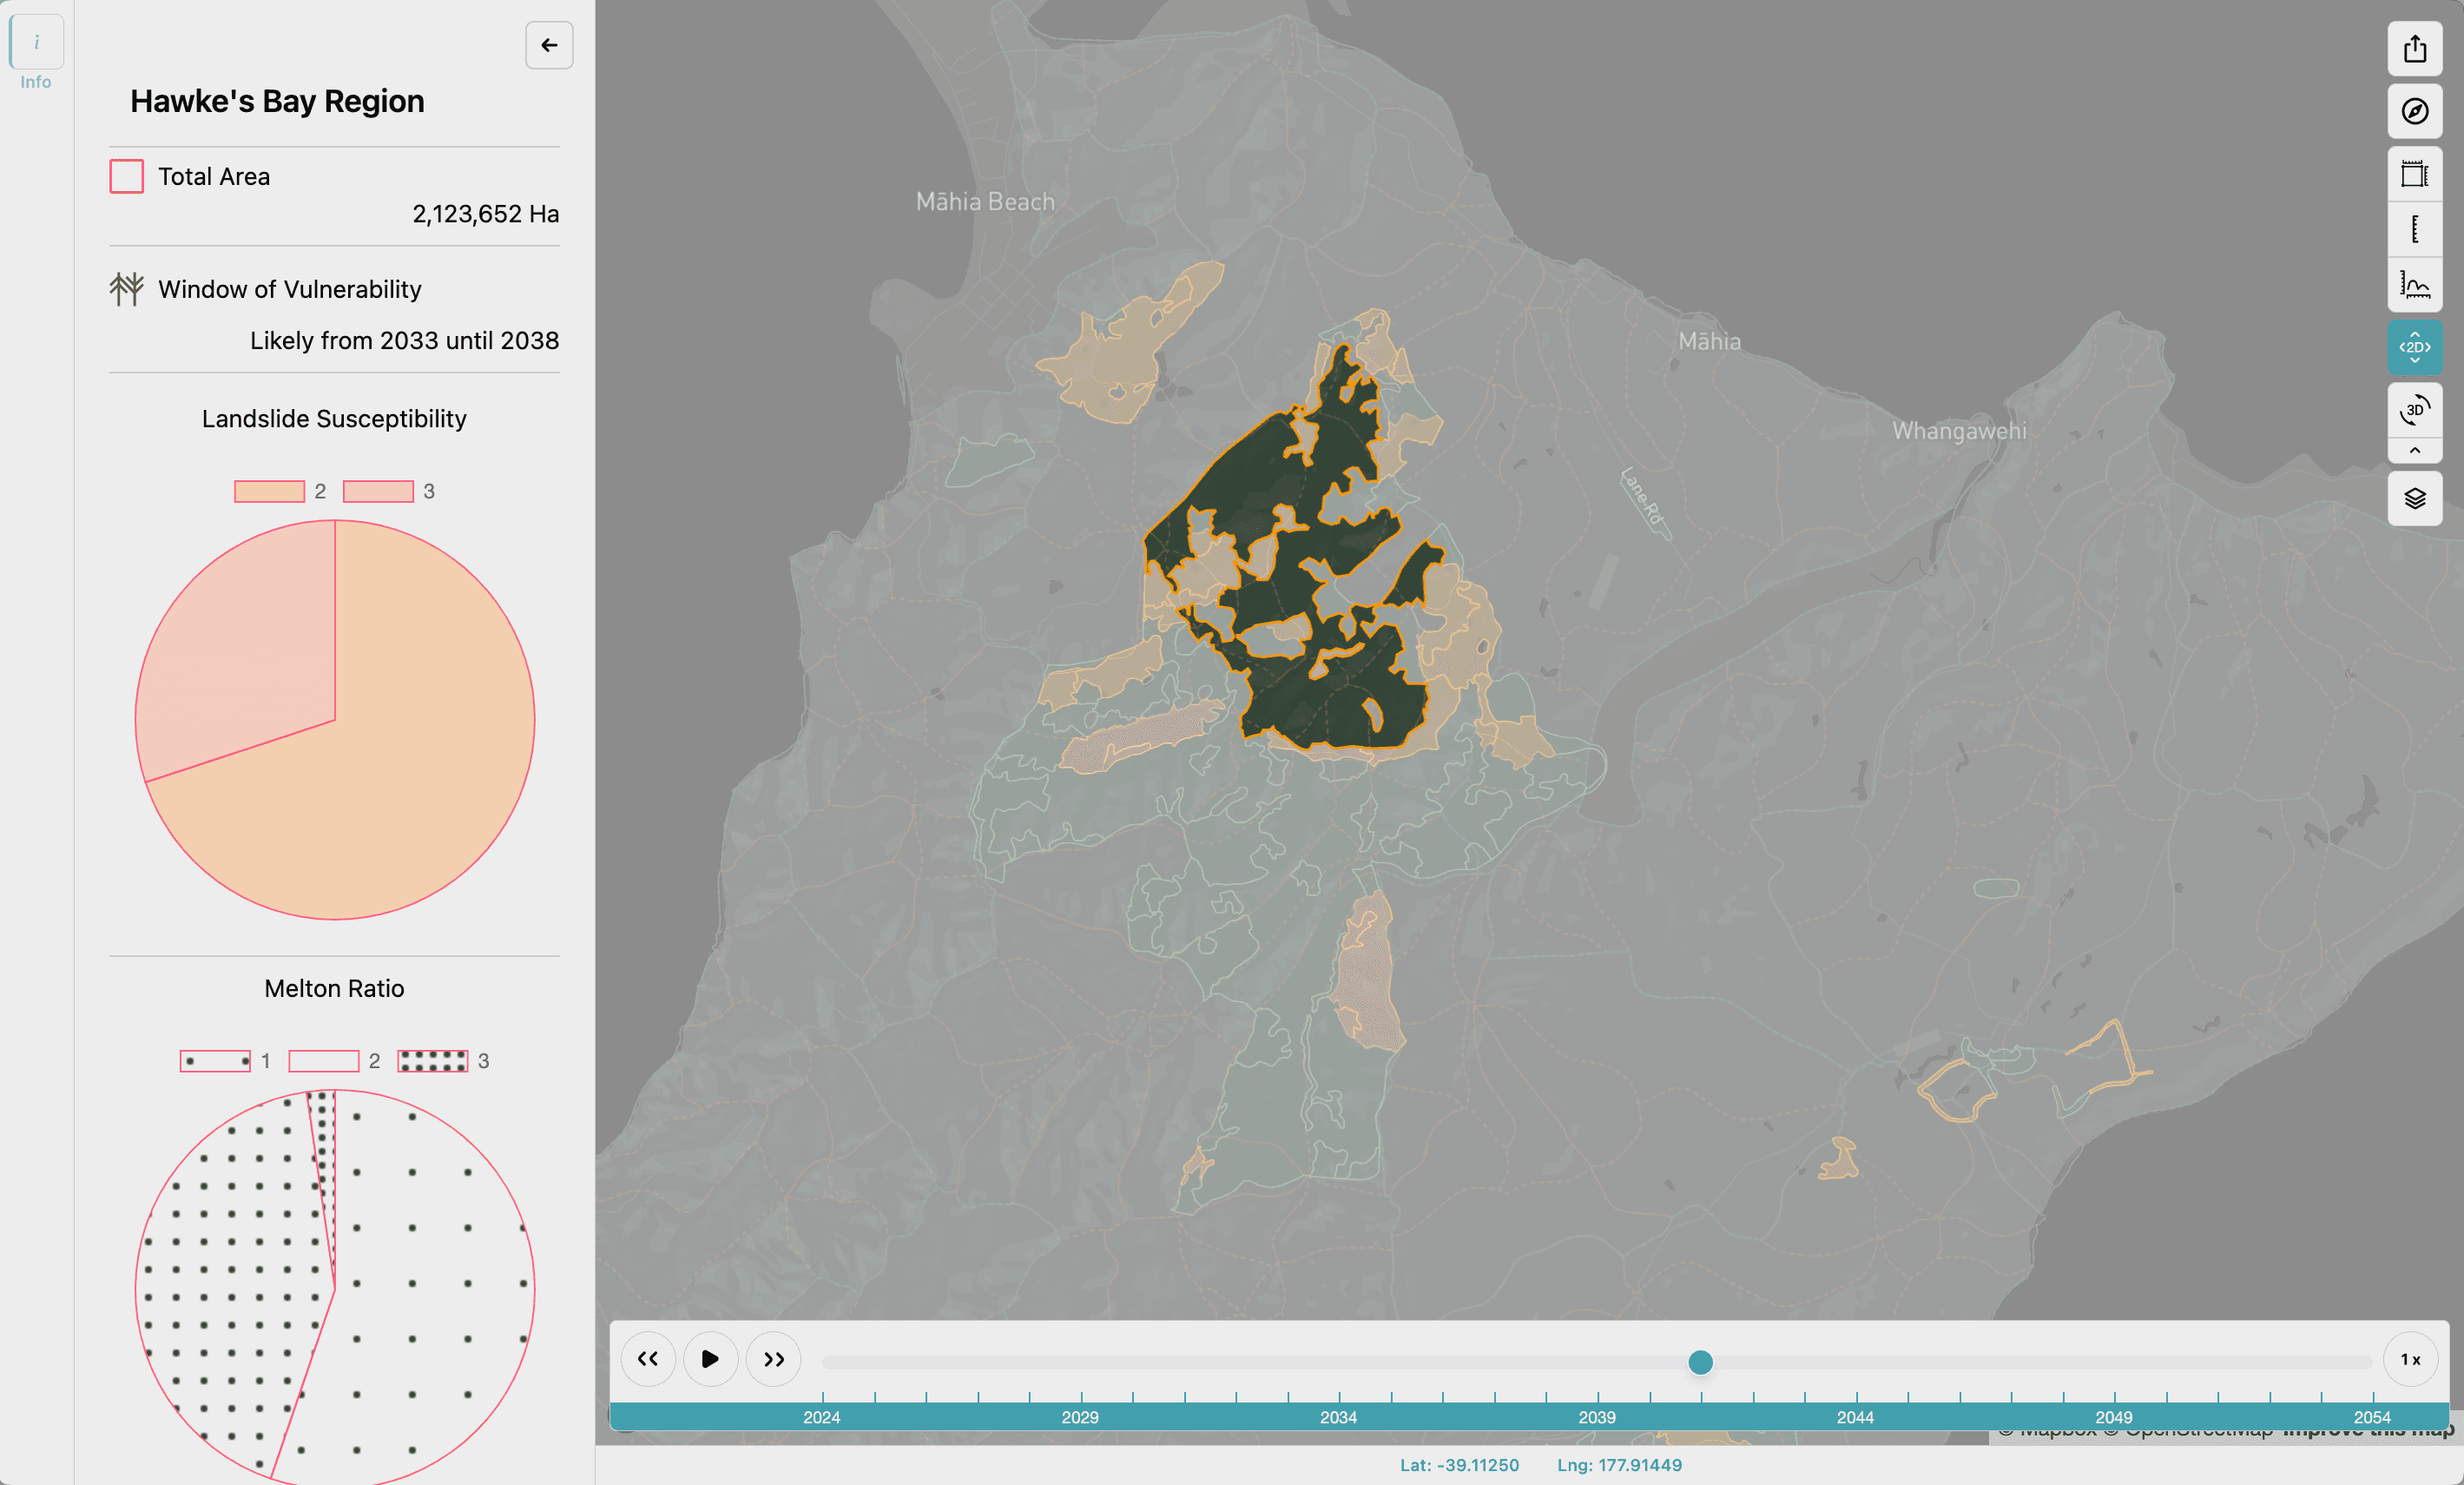
Swapping Between 2D and 3D Mode
Open the toolbar by clicking the little arrow under the tools icon top right. Click the 3D button to snap the map into 3D mode which will load a 3 dimensional terrain landscape. Clicking the 2D button will snap the map back into 2D mode.
Selecting a Feature
If a feature is clickable on the map, clicking the feature will zoom the viewport to the extent of the feature and show you information about that feature. Some features are not clickable and provide visual context only.
Multi-Selection Modal
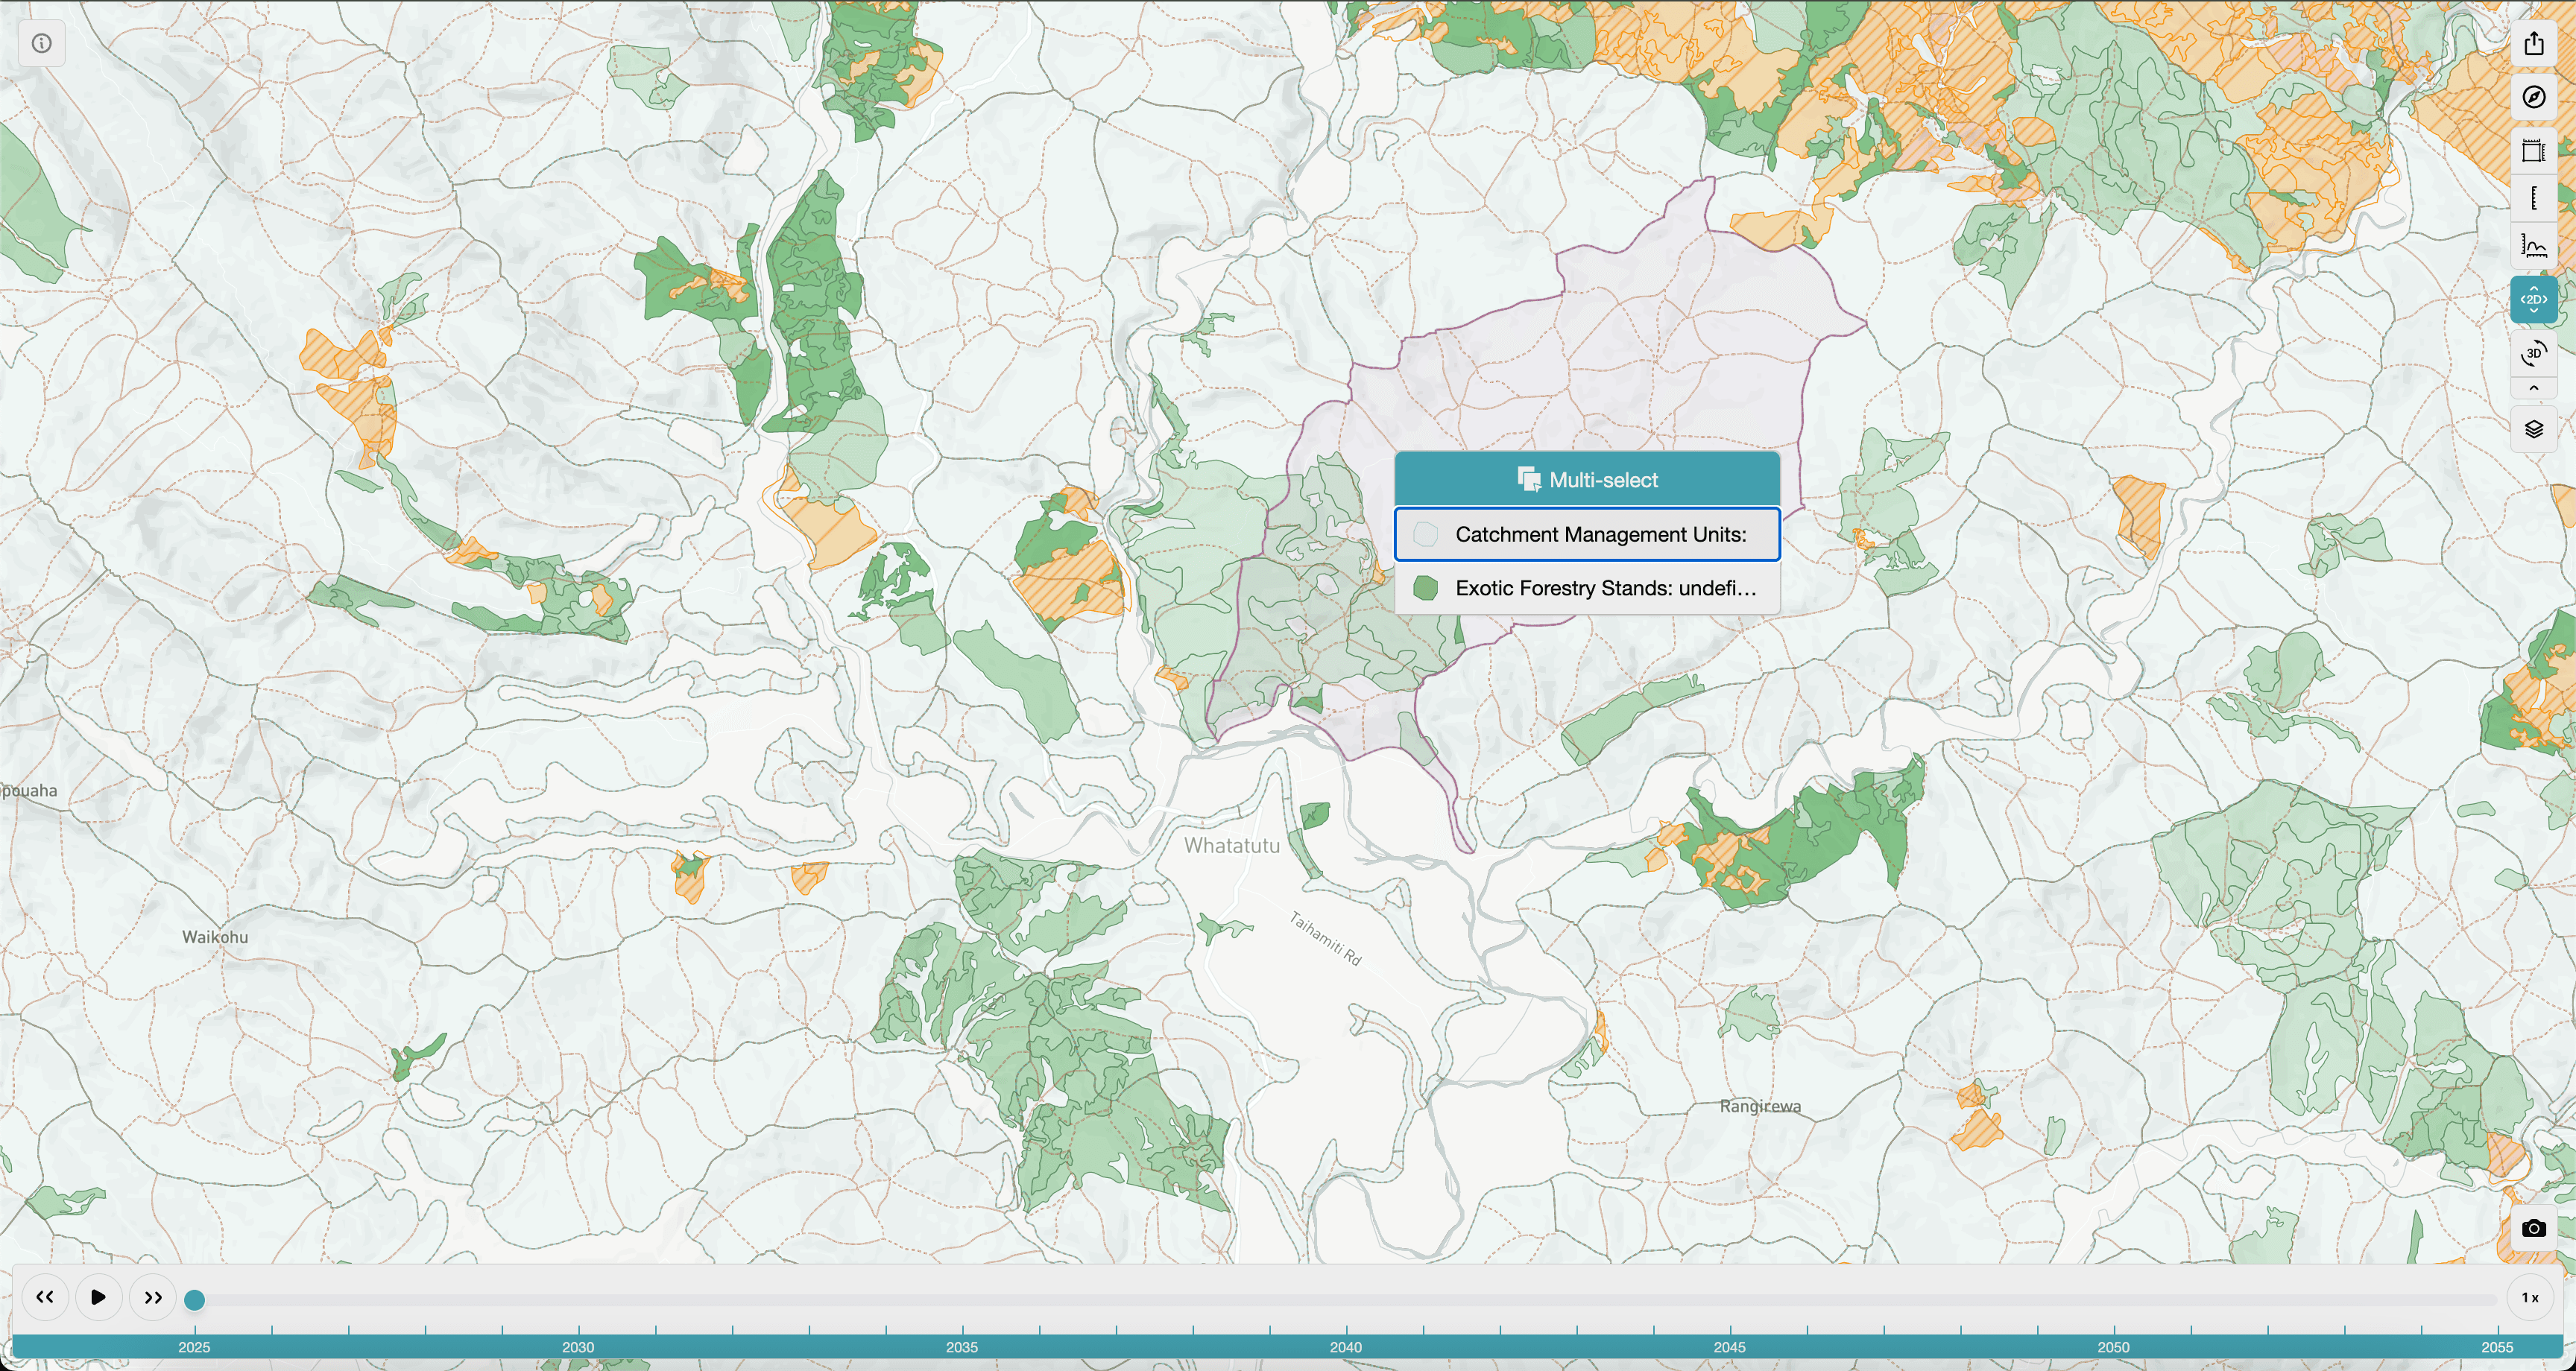
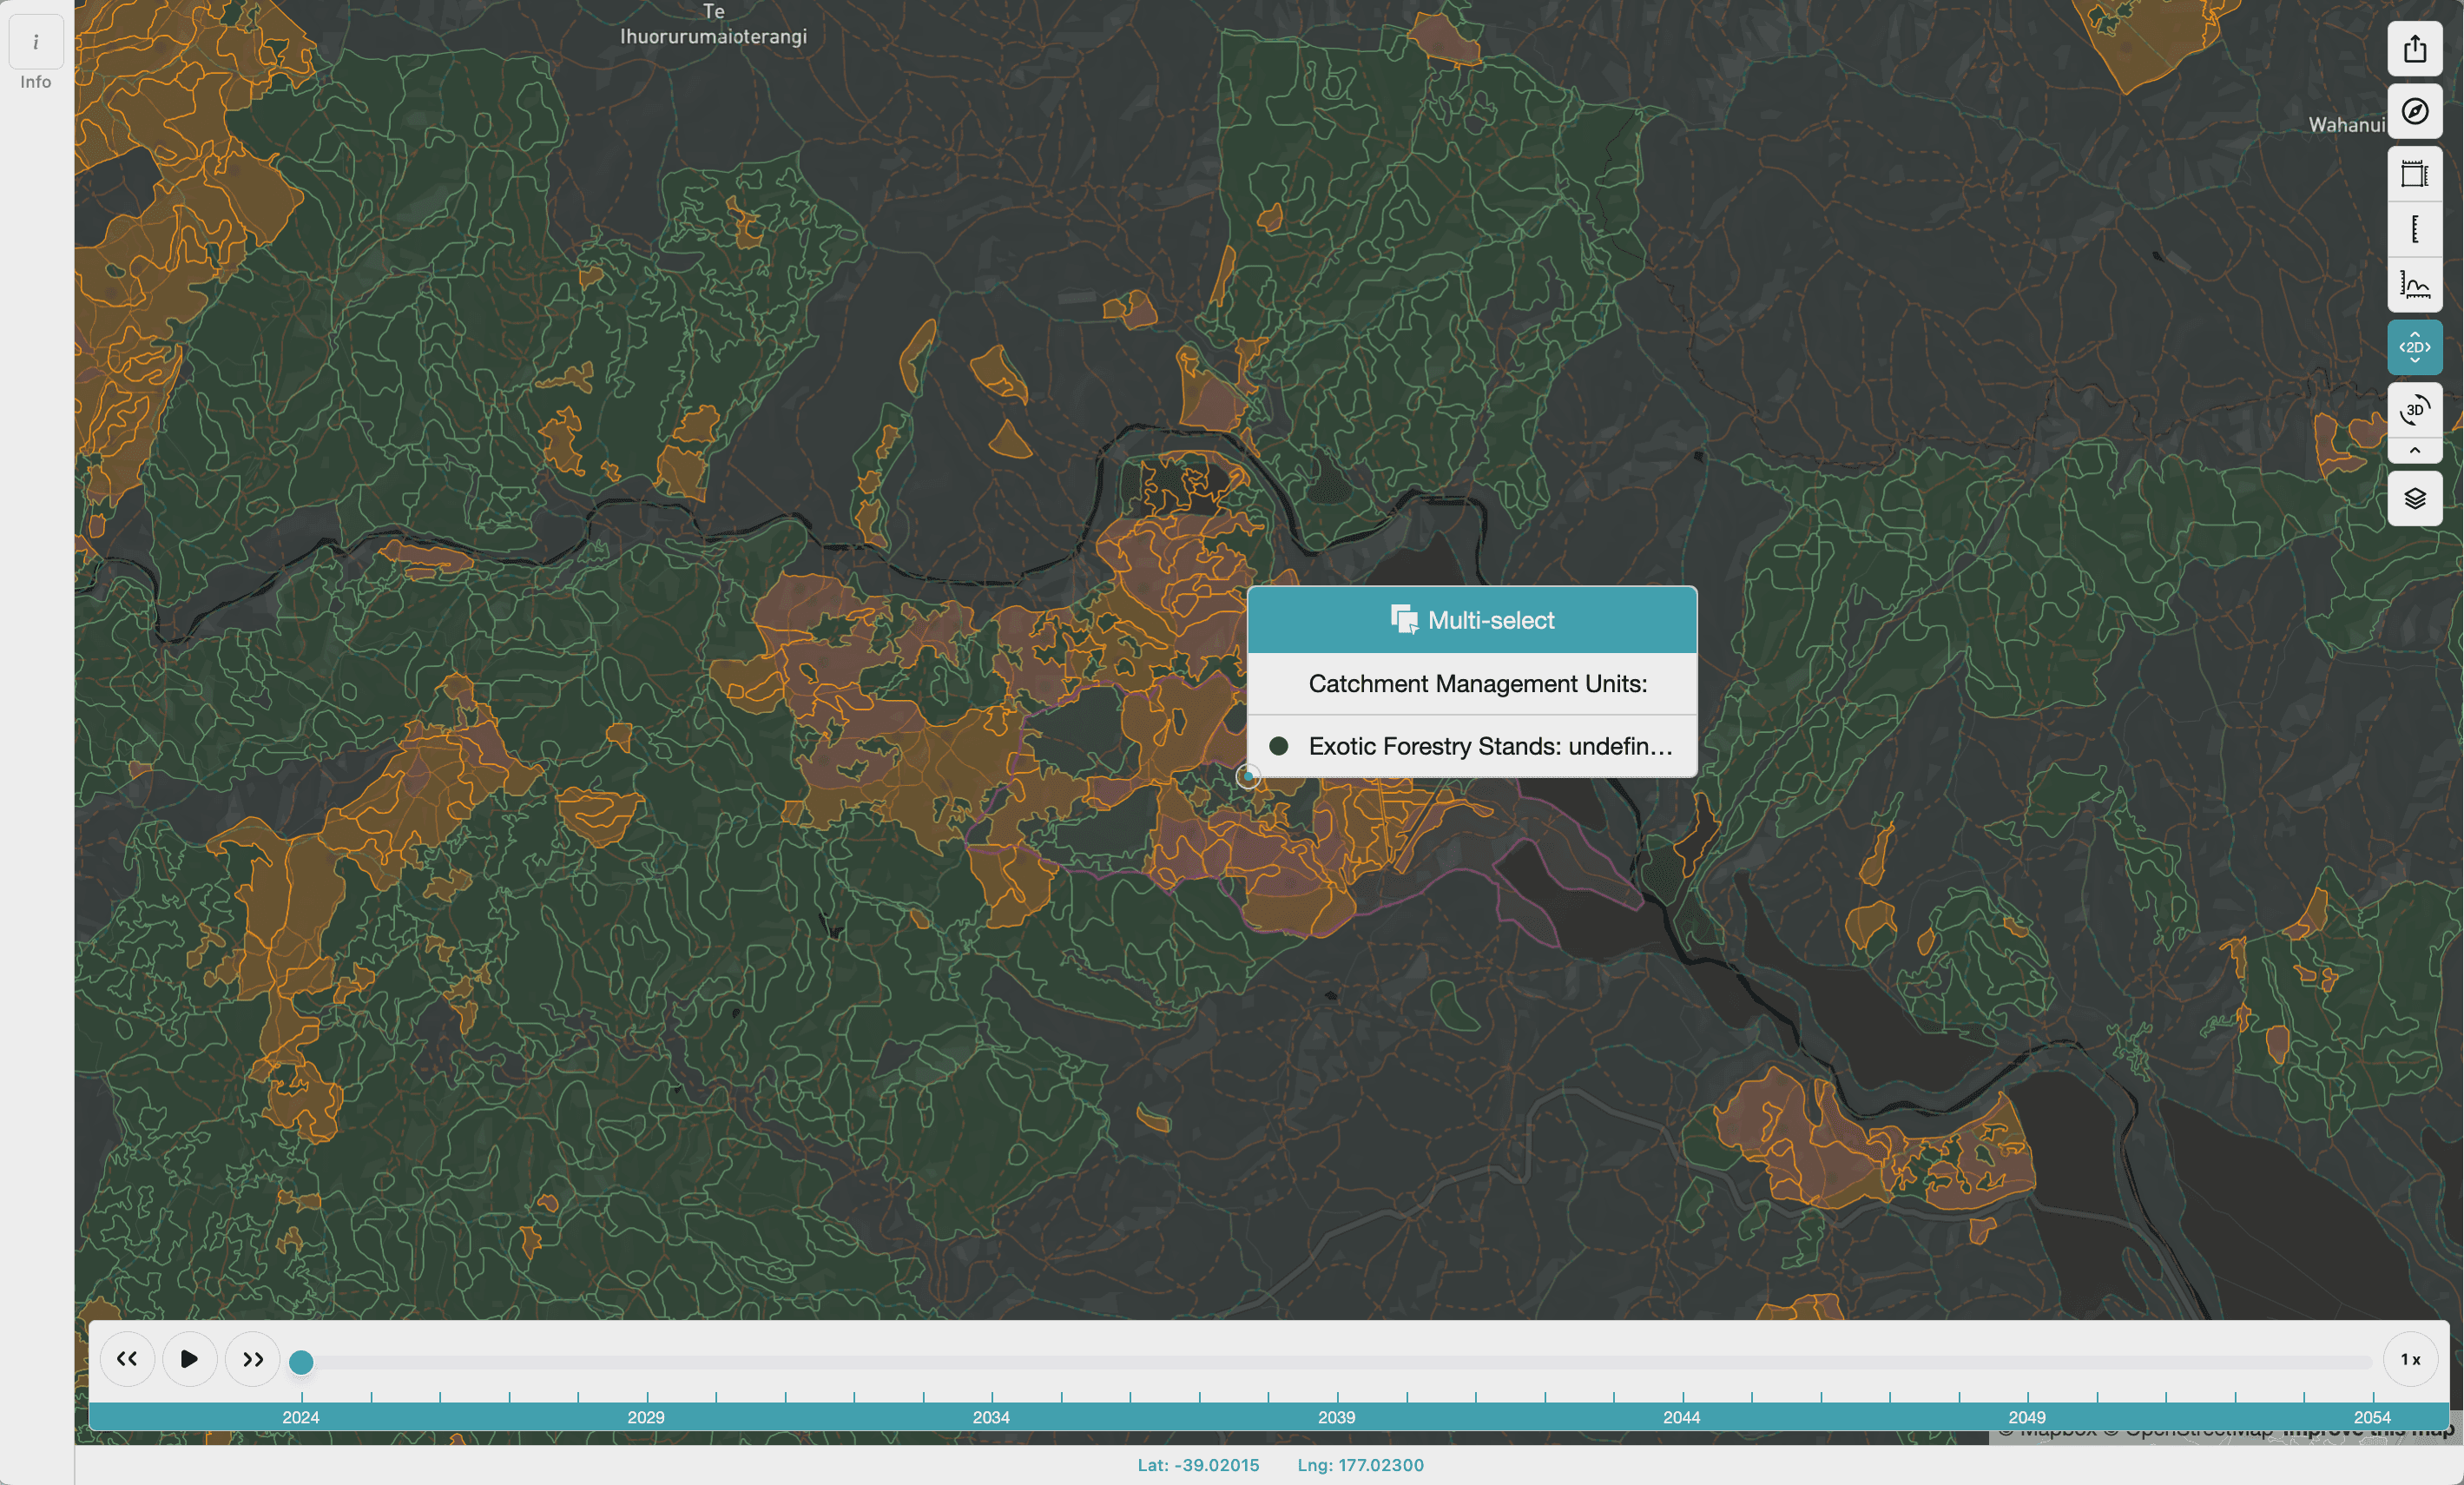
When there are several overlapping features, a multi-selection popup will show, giving you the option to choose which feature to select. Clicking the option in the menu will zoom you to the feature.
Changing Basemaps
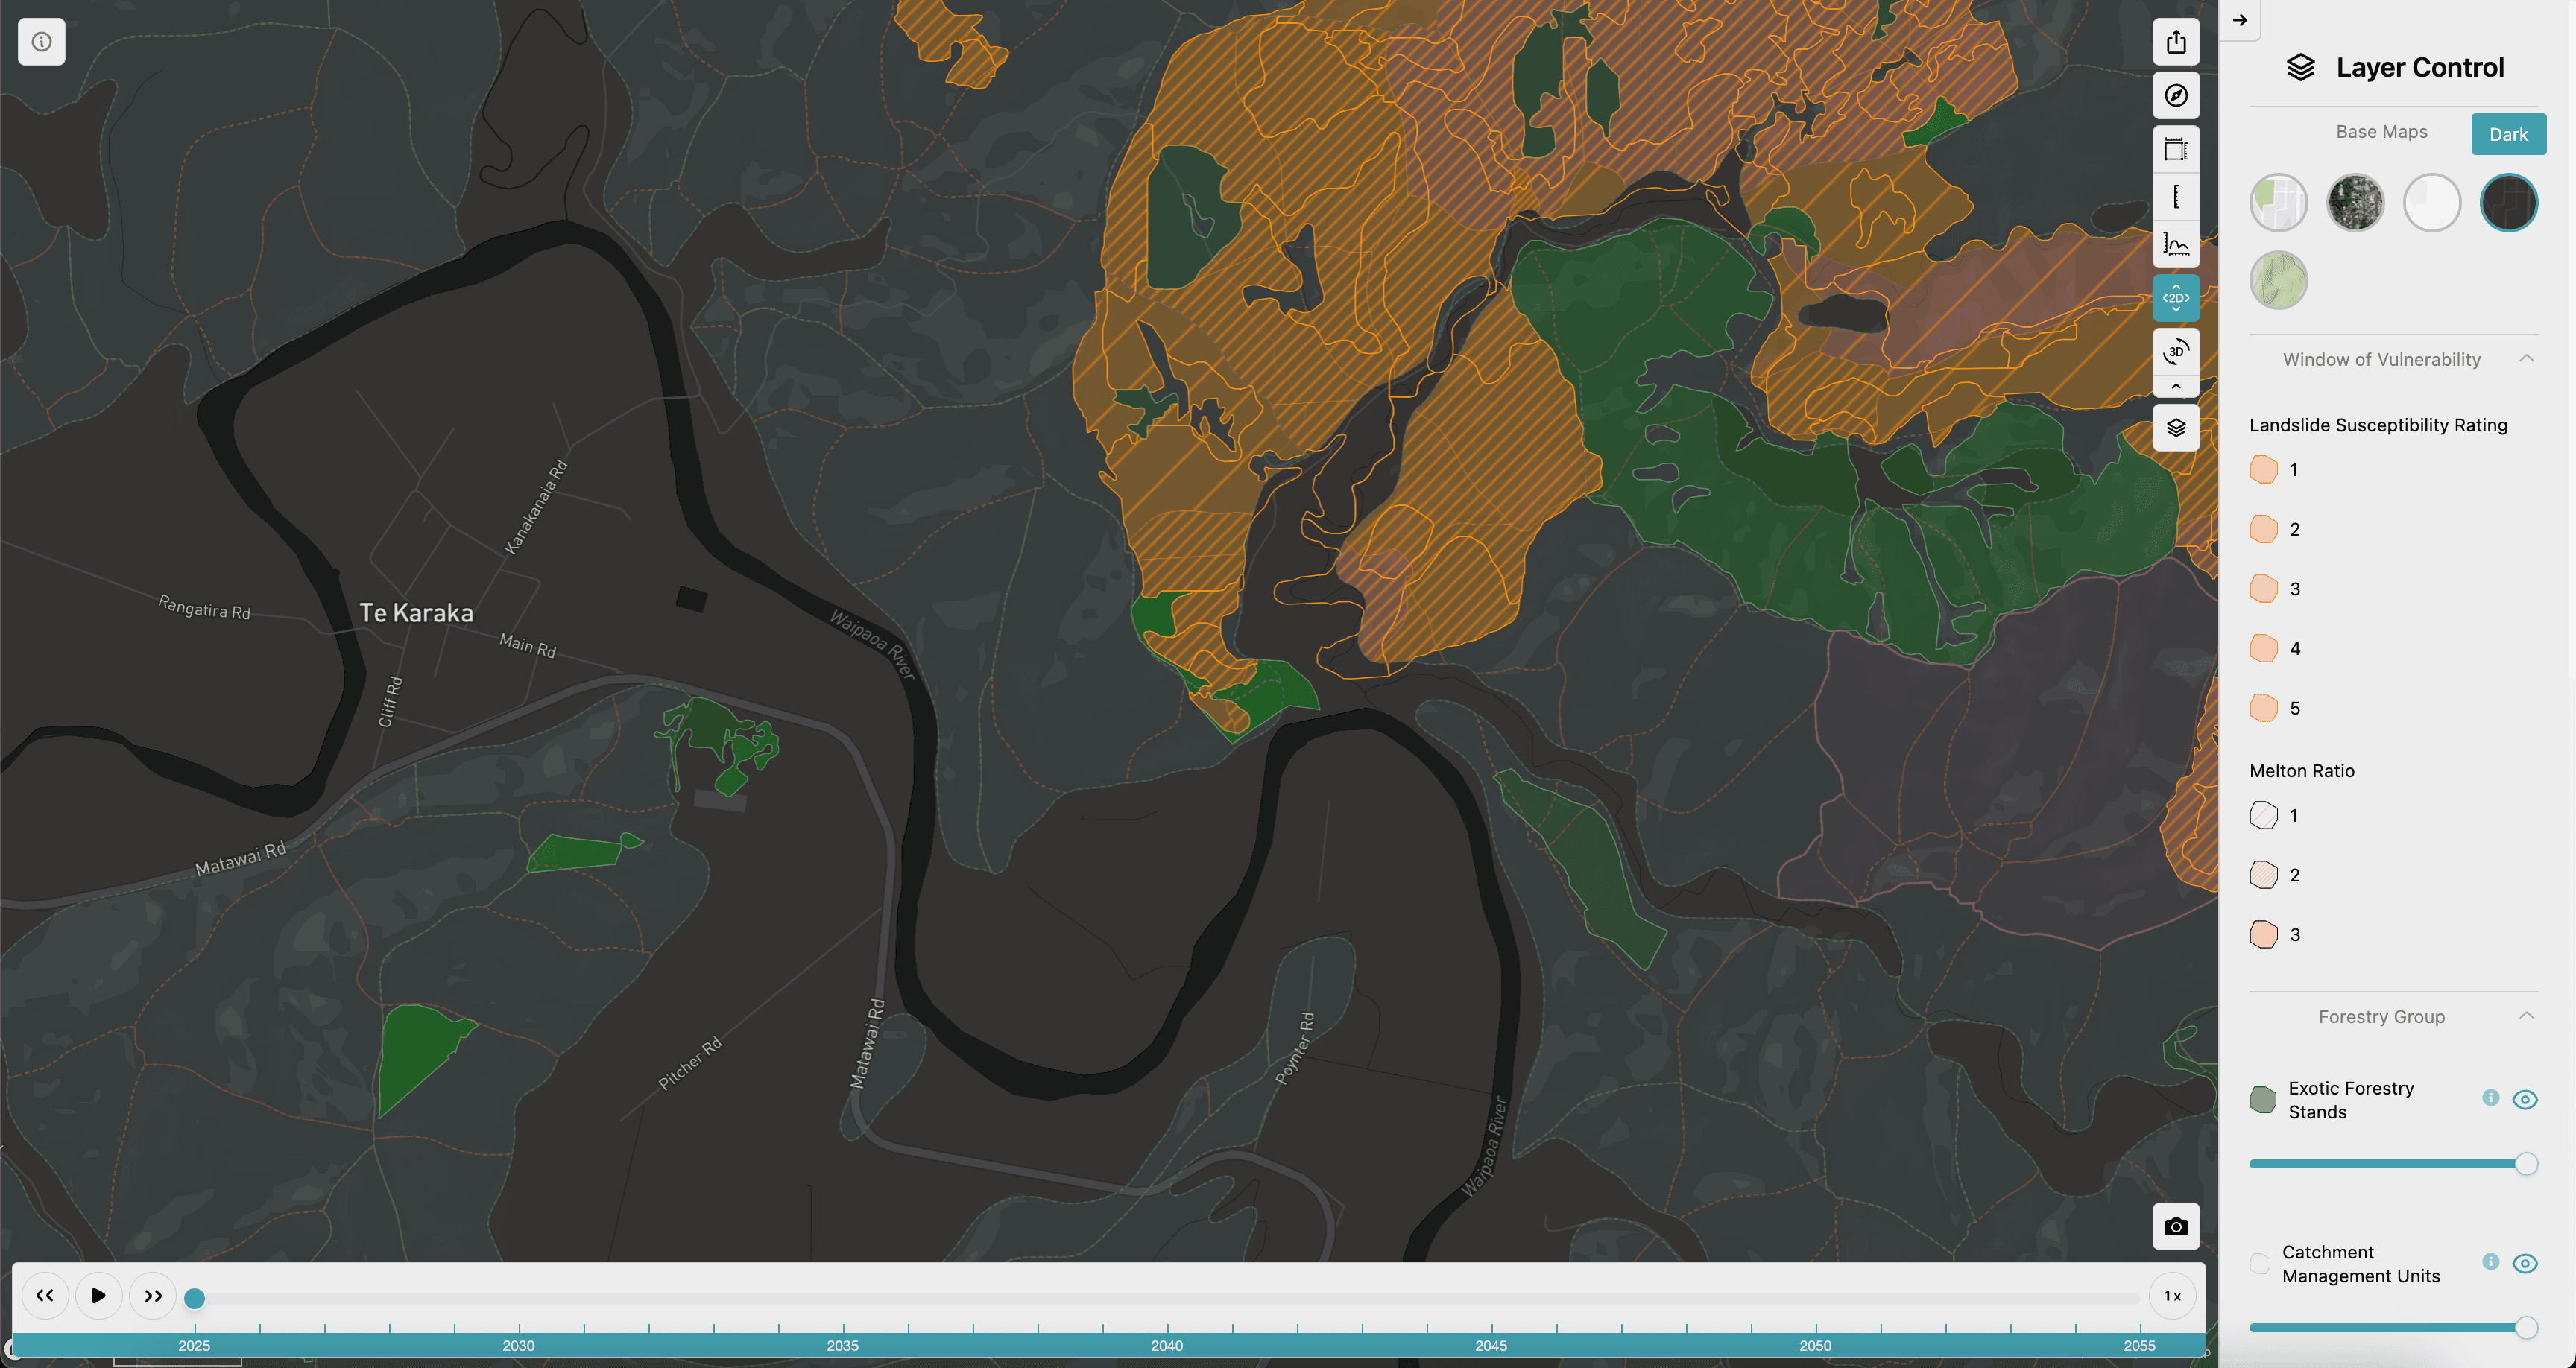
Click the Layers icon top right > expand the Basemaps layer group > Choose one of the four available basemaps.
Toggling Layers
Click the Layers icon top right to expand the layers menu. You can toggle a layer on and off or change it’s opacity (transparency) by sliding the opacity slider.
Rotating the Map
Right click and drag the map to rotate it. In 3D mode right click and drag up or down to change the tilt of the map or drag right to left to rotate it.
Zooming In and Out
Use the scroll wheel on your mouse, or the trackpad on your laptop, to zoom in and out. You can also double click the map to zoom in, or hold shift and double click to zoom out.
Measuring an Area
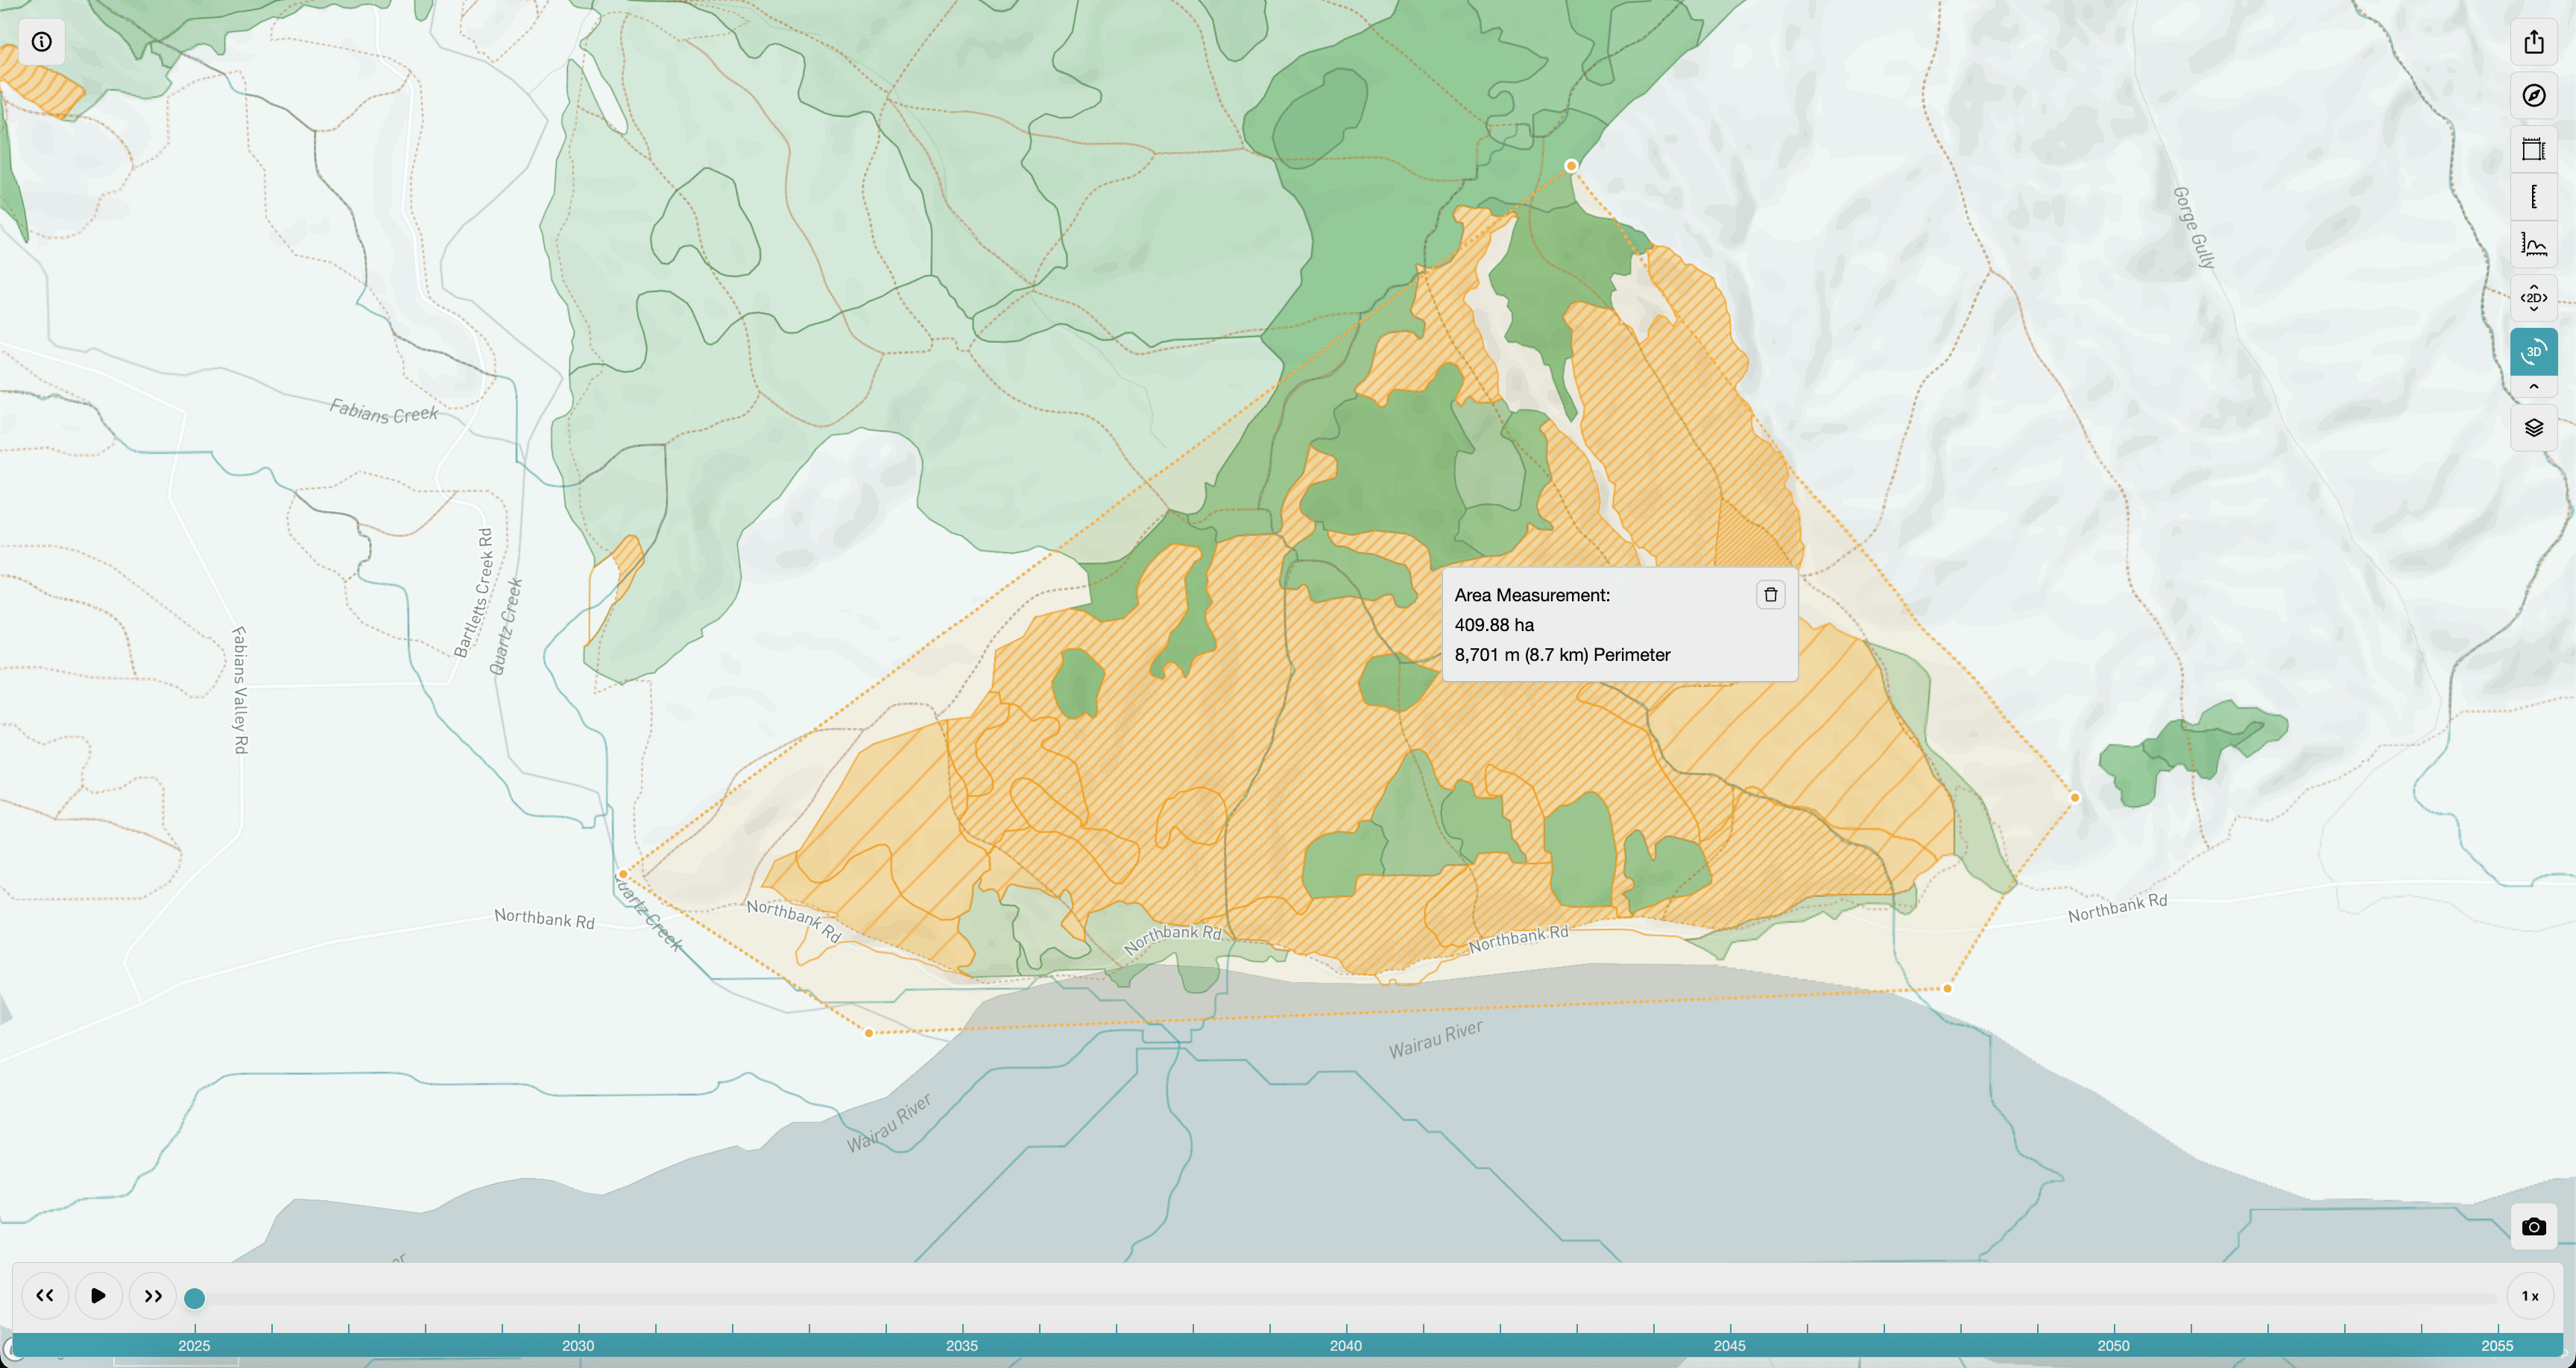
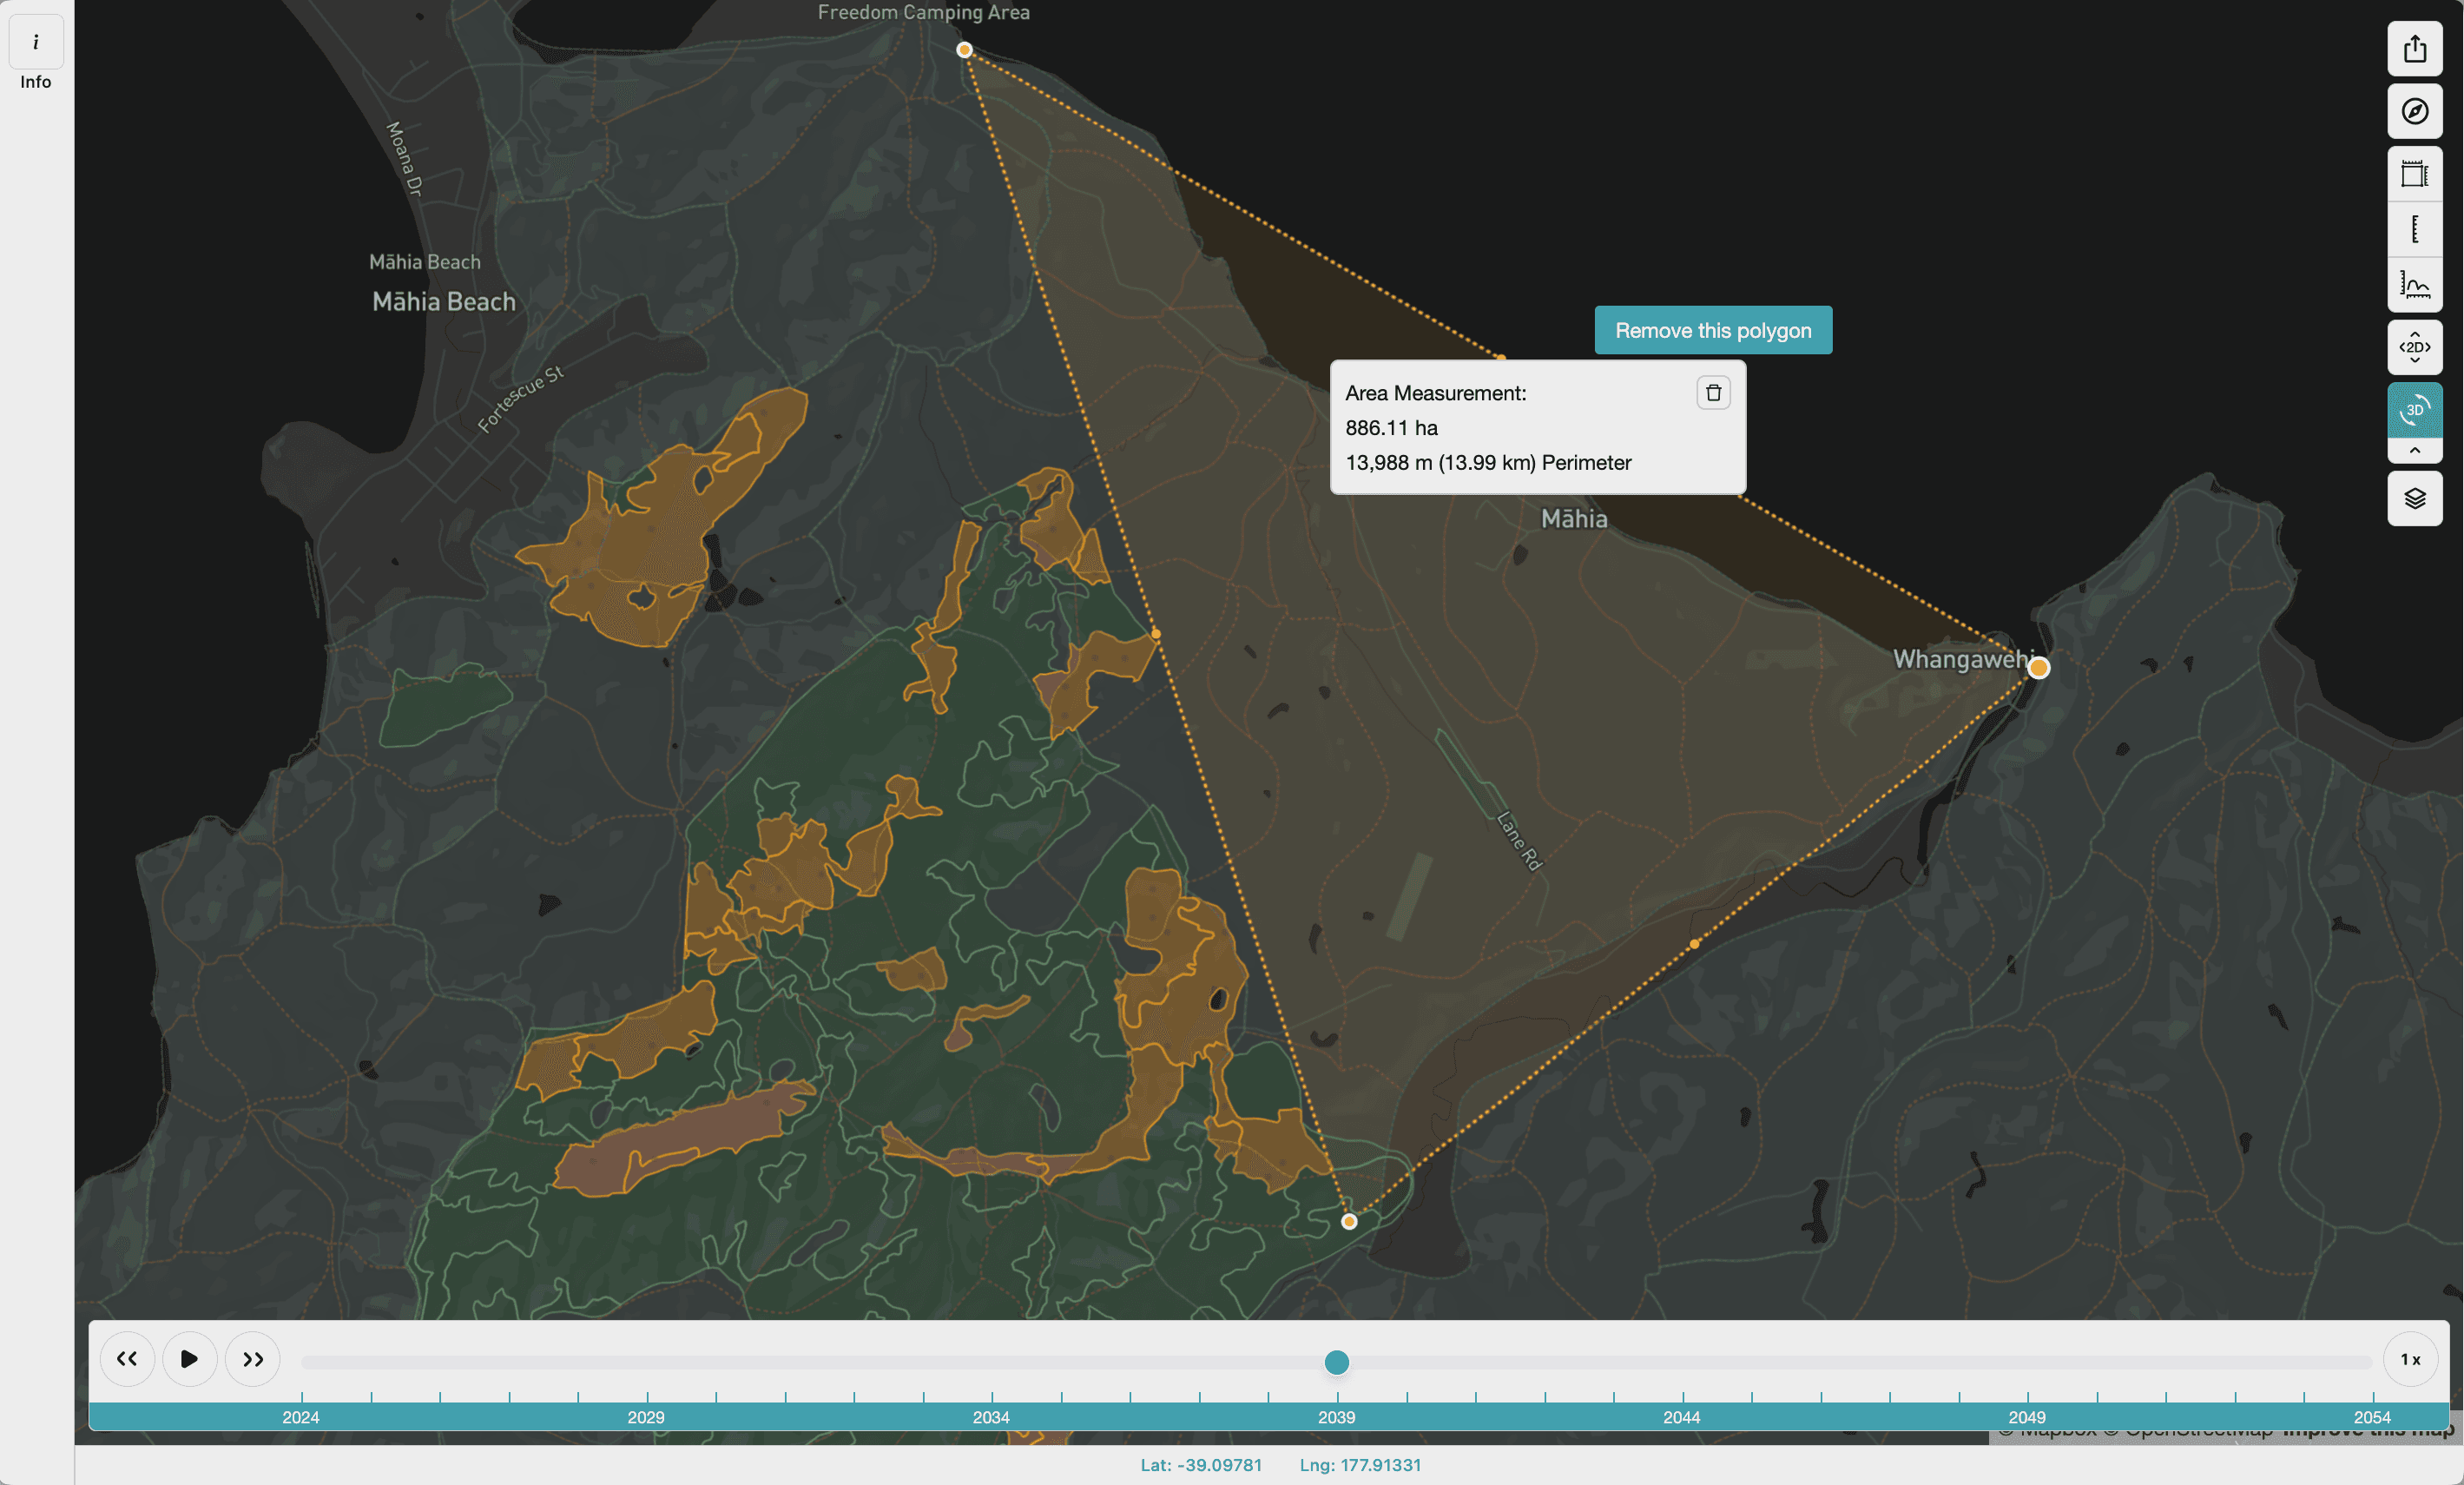
Users can measure an area by clicking the Measure Area tool > Clicking on the map and drawing the area to measure. When you’re finished > double click to complete the measurement area. A popup will appear with your measurements.
Measuring a Distance
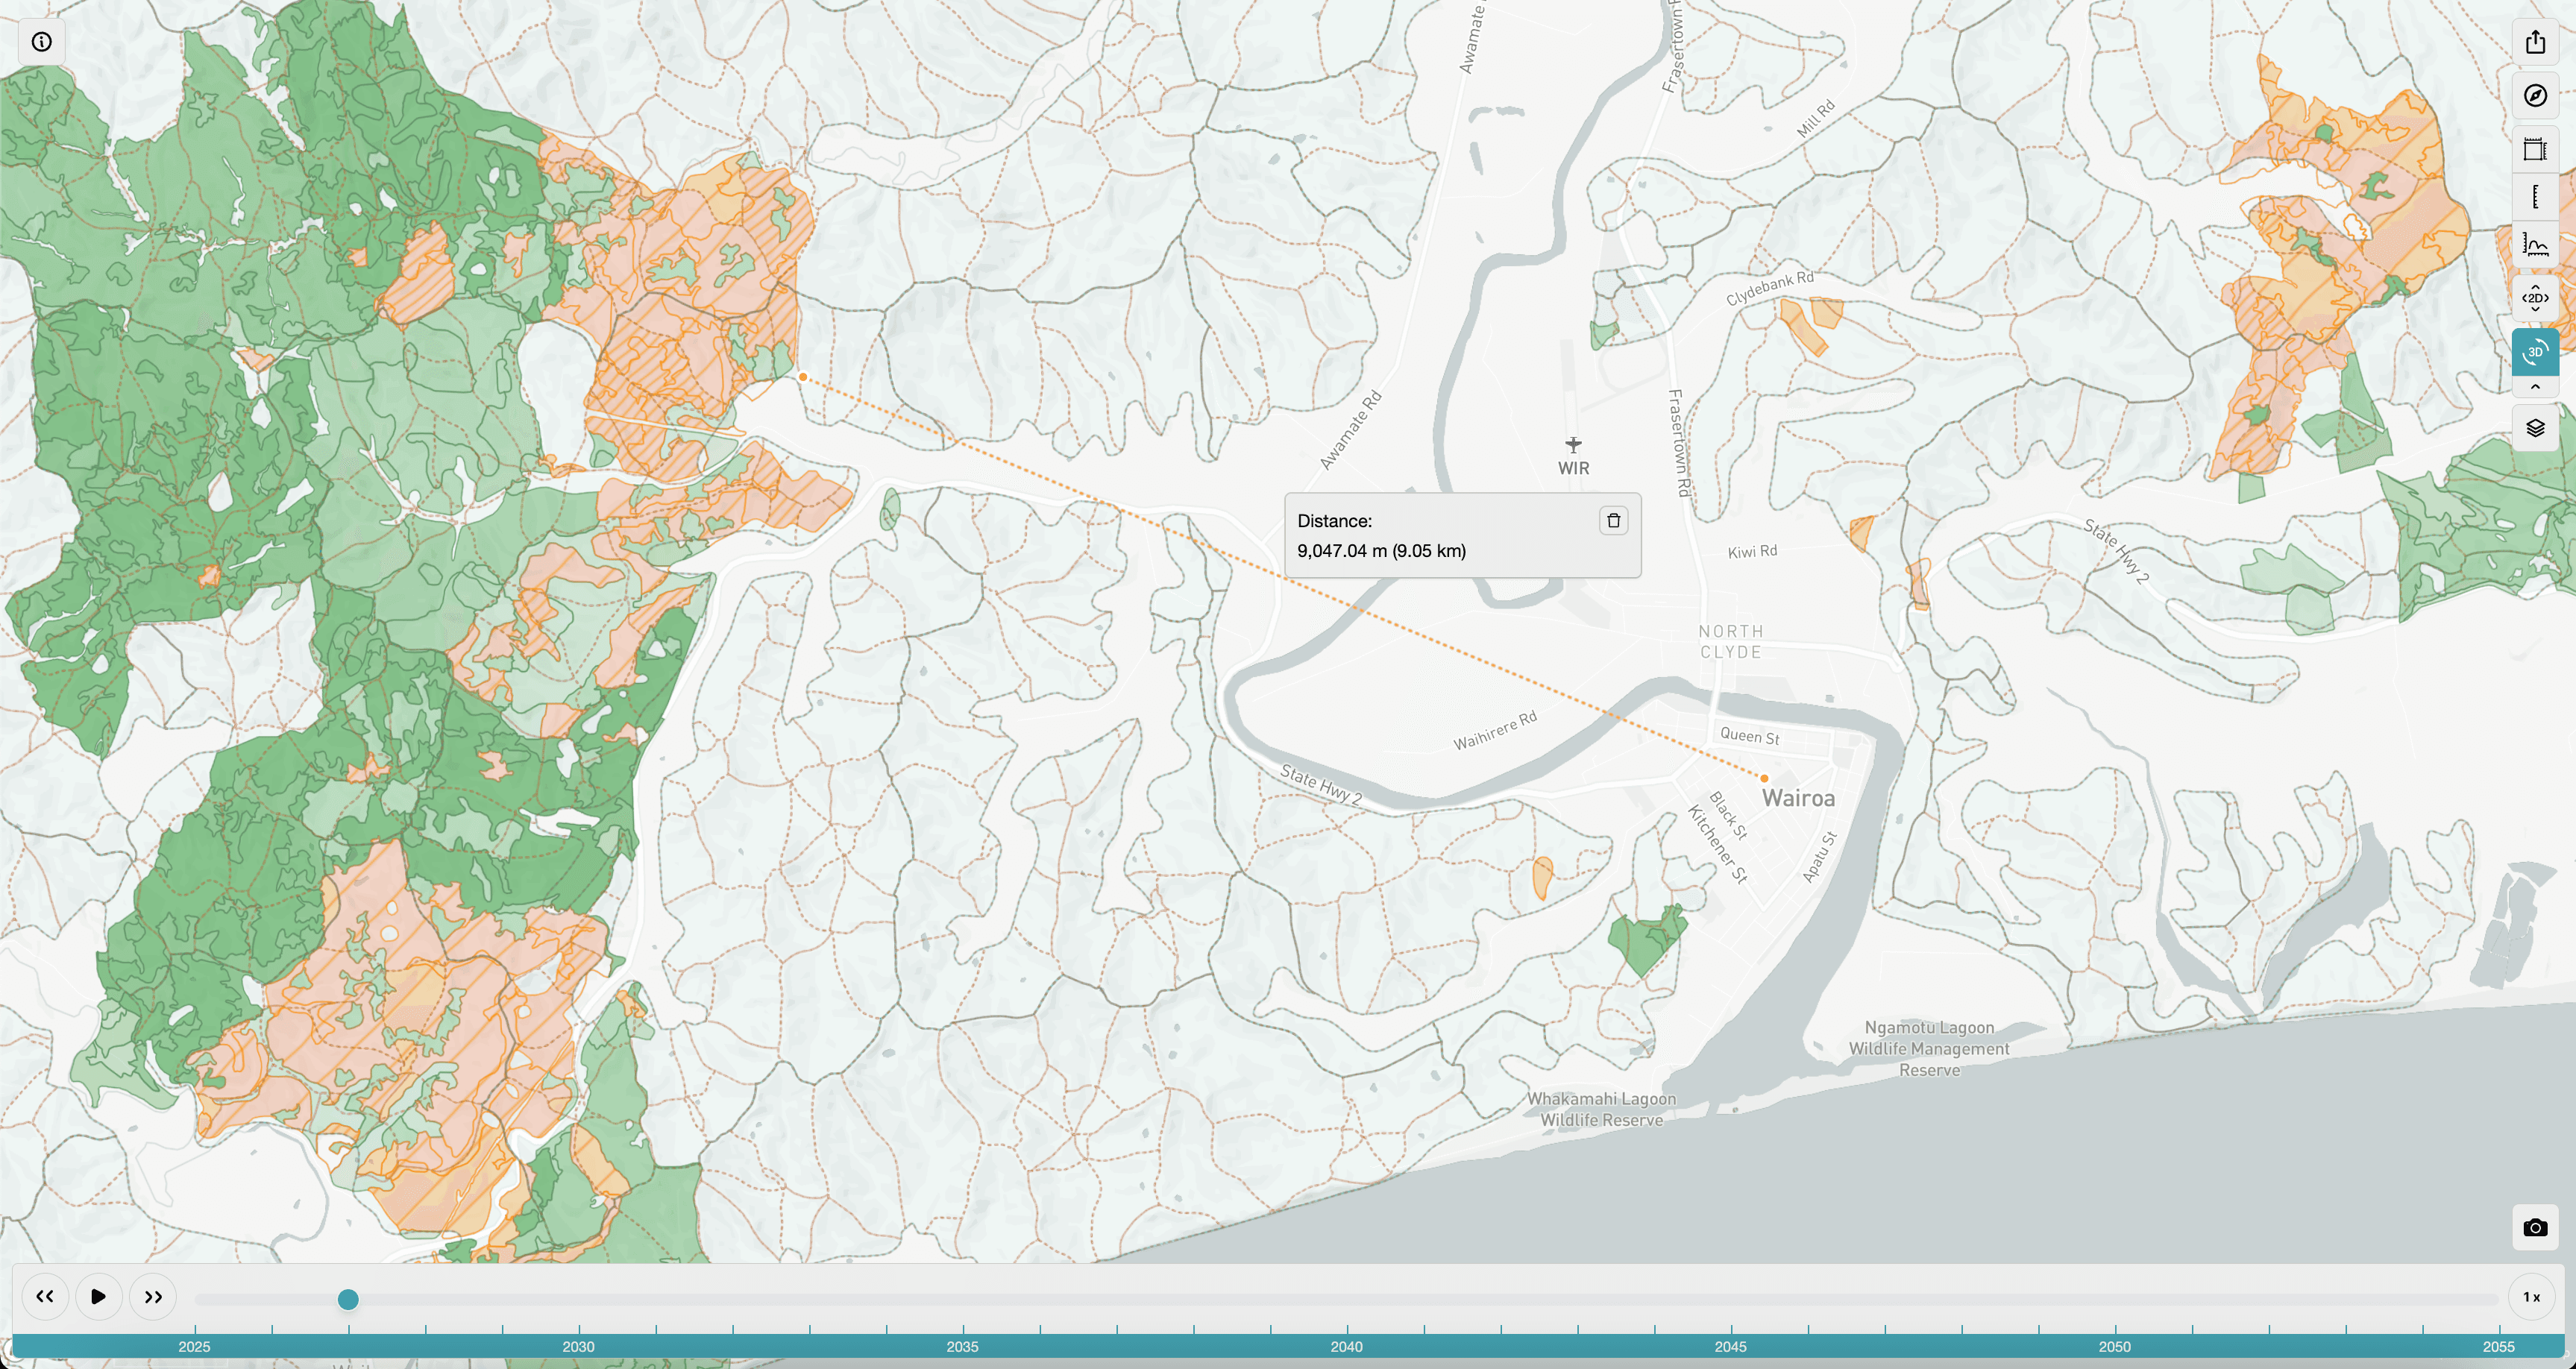
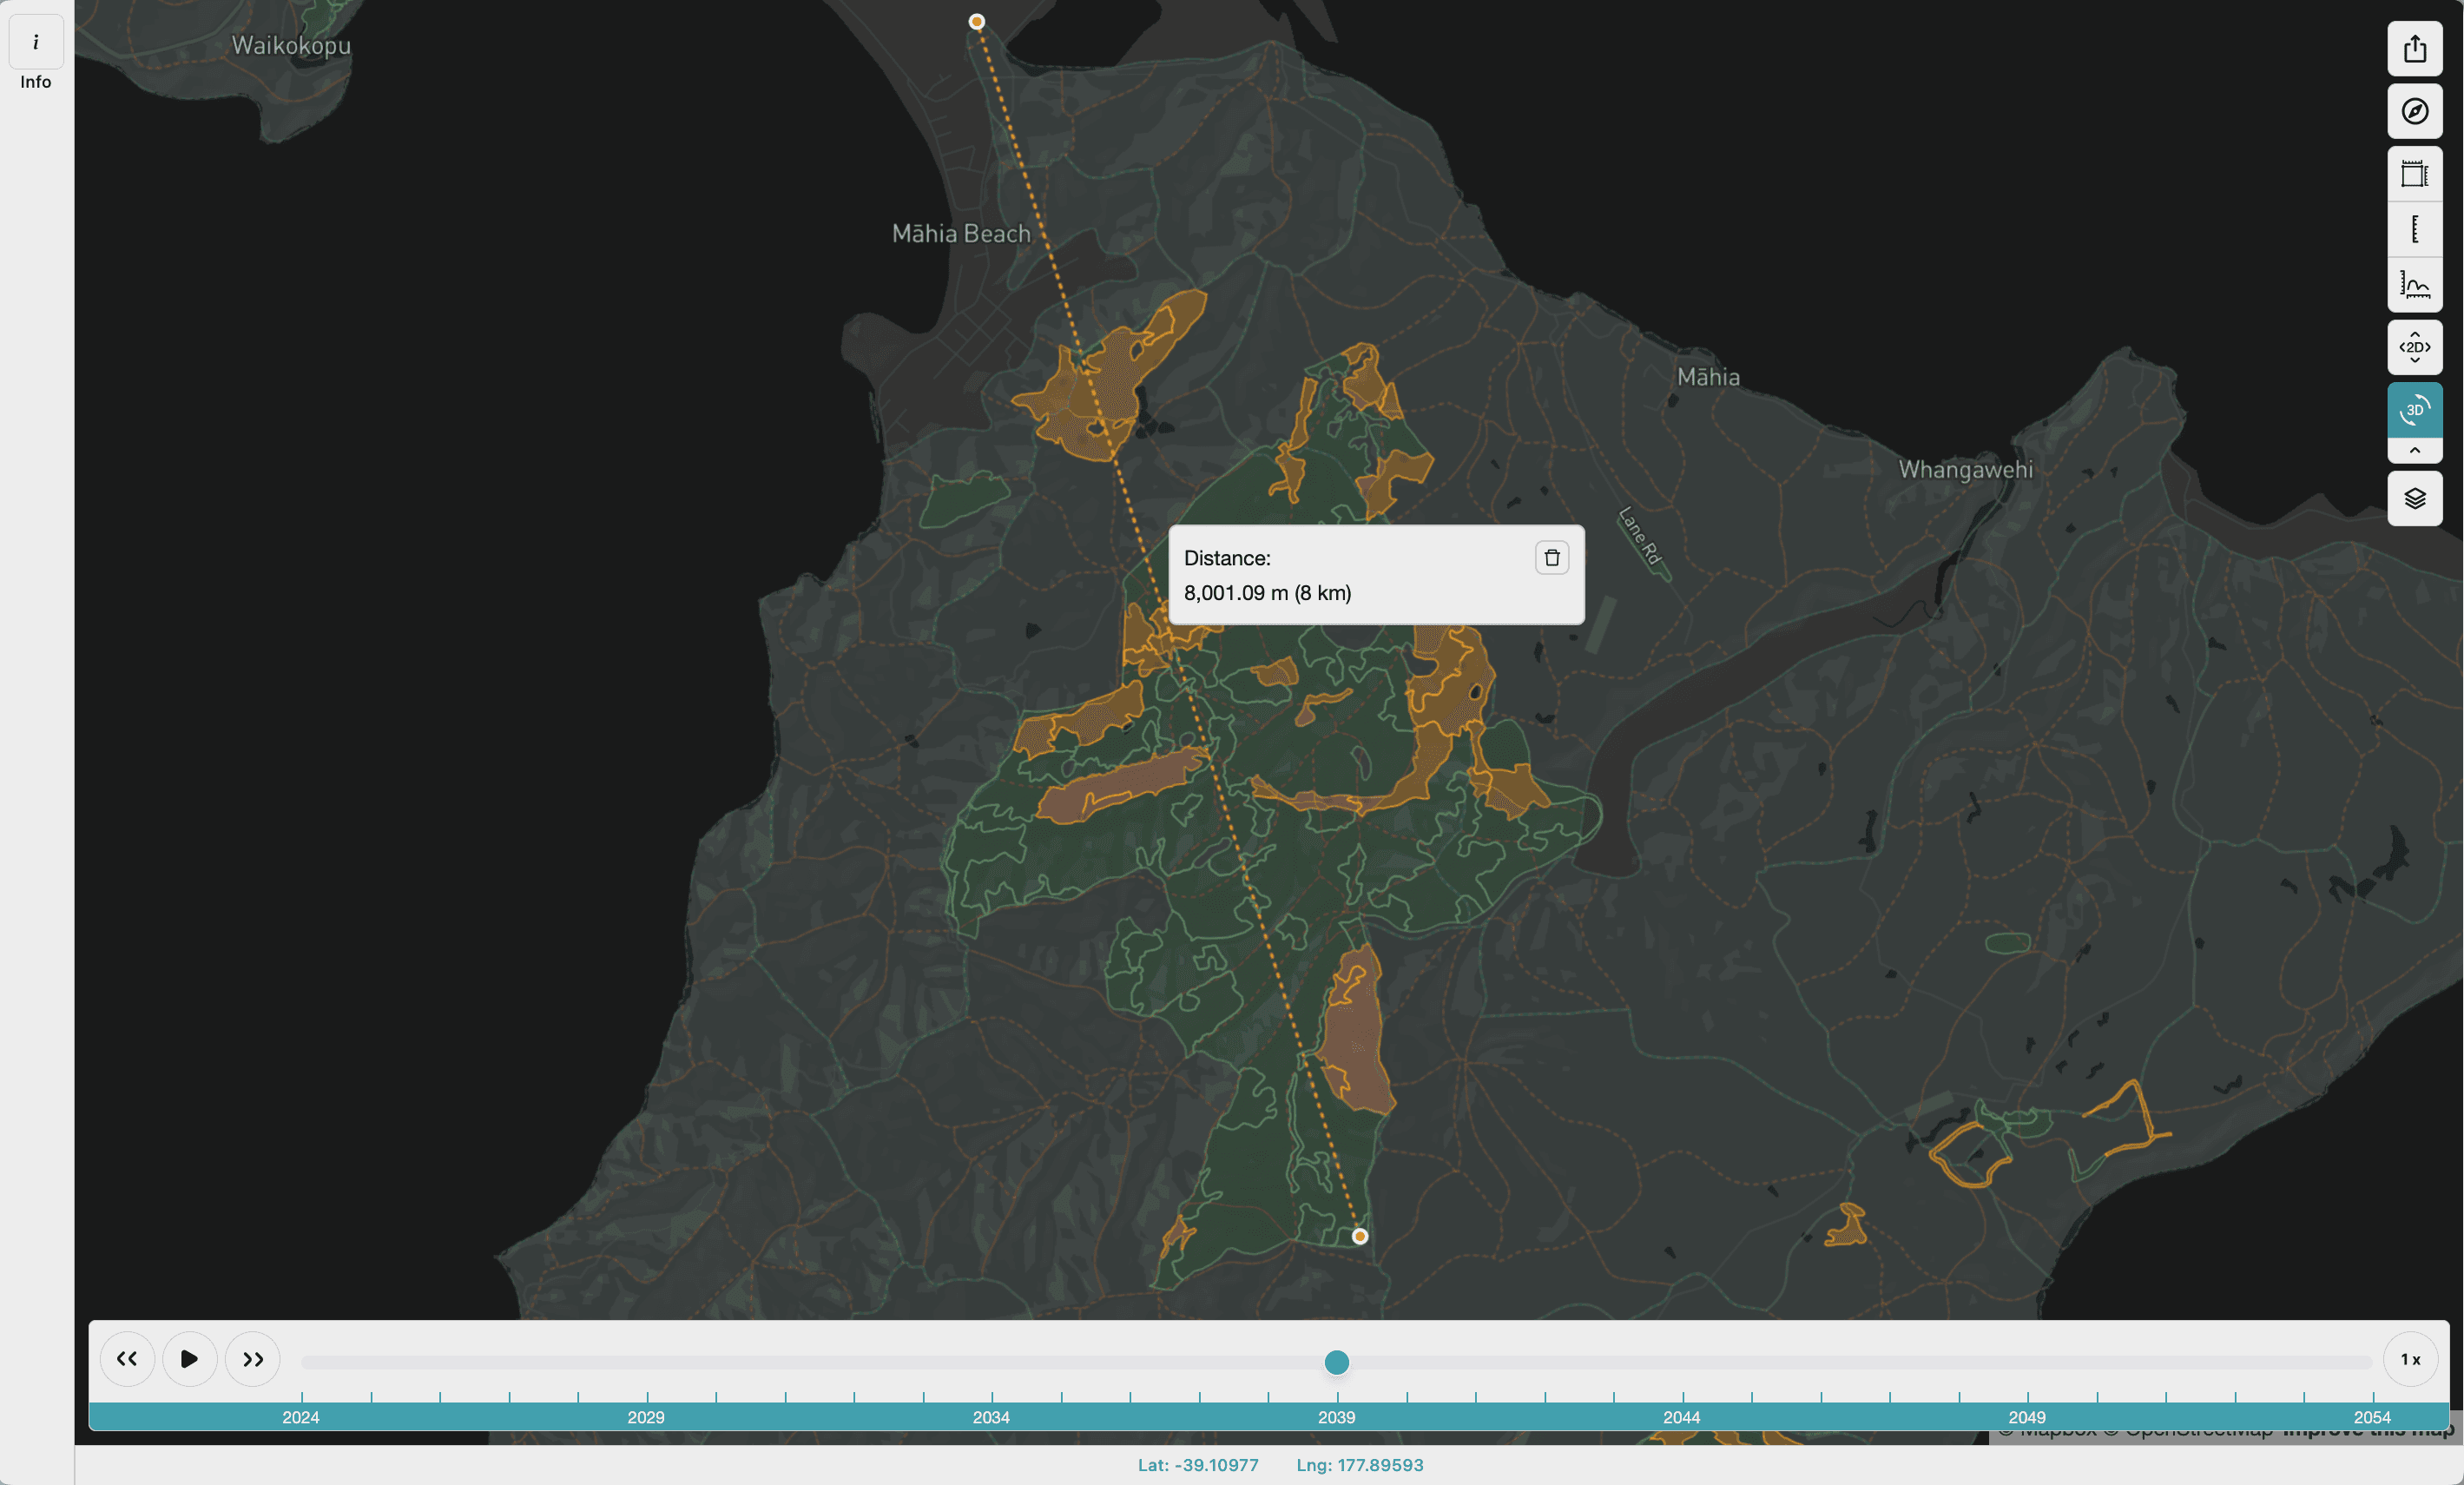
Users can measure a distance by clicking the Measure Line tool > Clicking on the map and drawing a path for what to measure. When you’re finished > double click to complete the line. A popup will appear with your measurements.
Measuring an Elevation Profile Along a Line
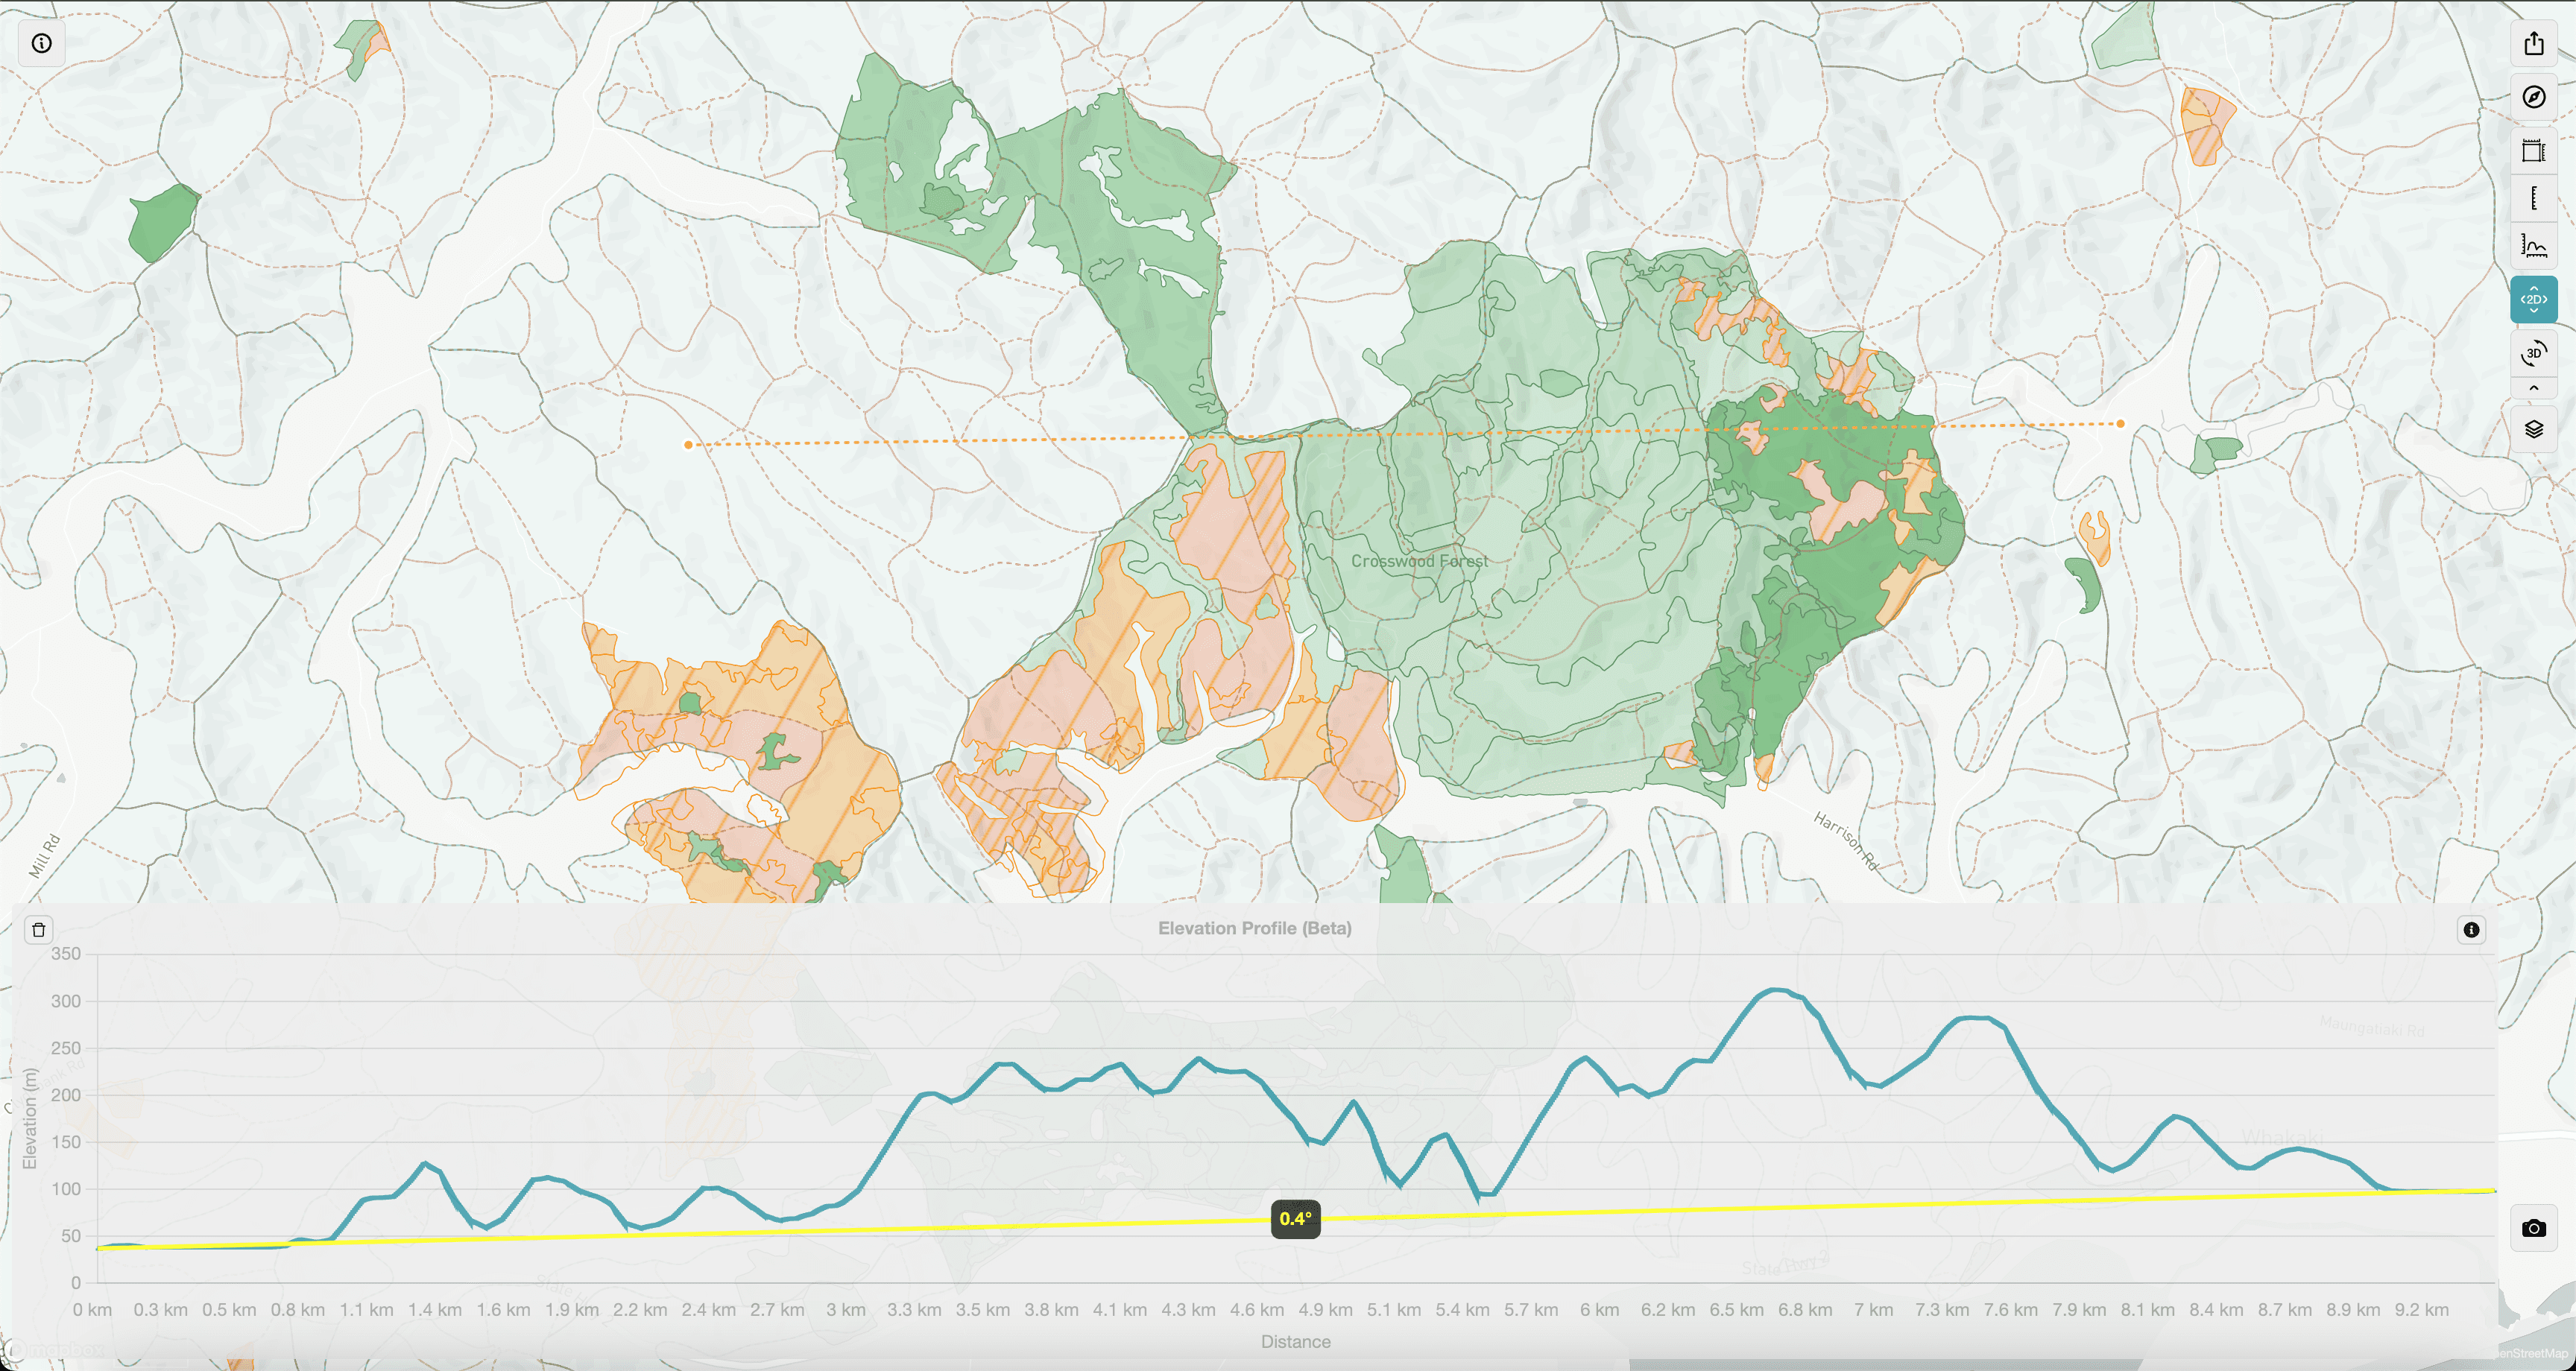
Users can measure an elevation profile by clicking the Elevation Profile tool > Clicking on the map and drawing a path for what to measure. When you’re finished > double click to complete the line. A chart with the elevation profile along the path you drew will appear.
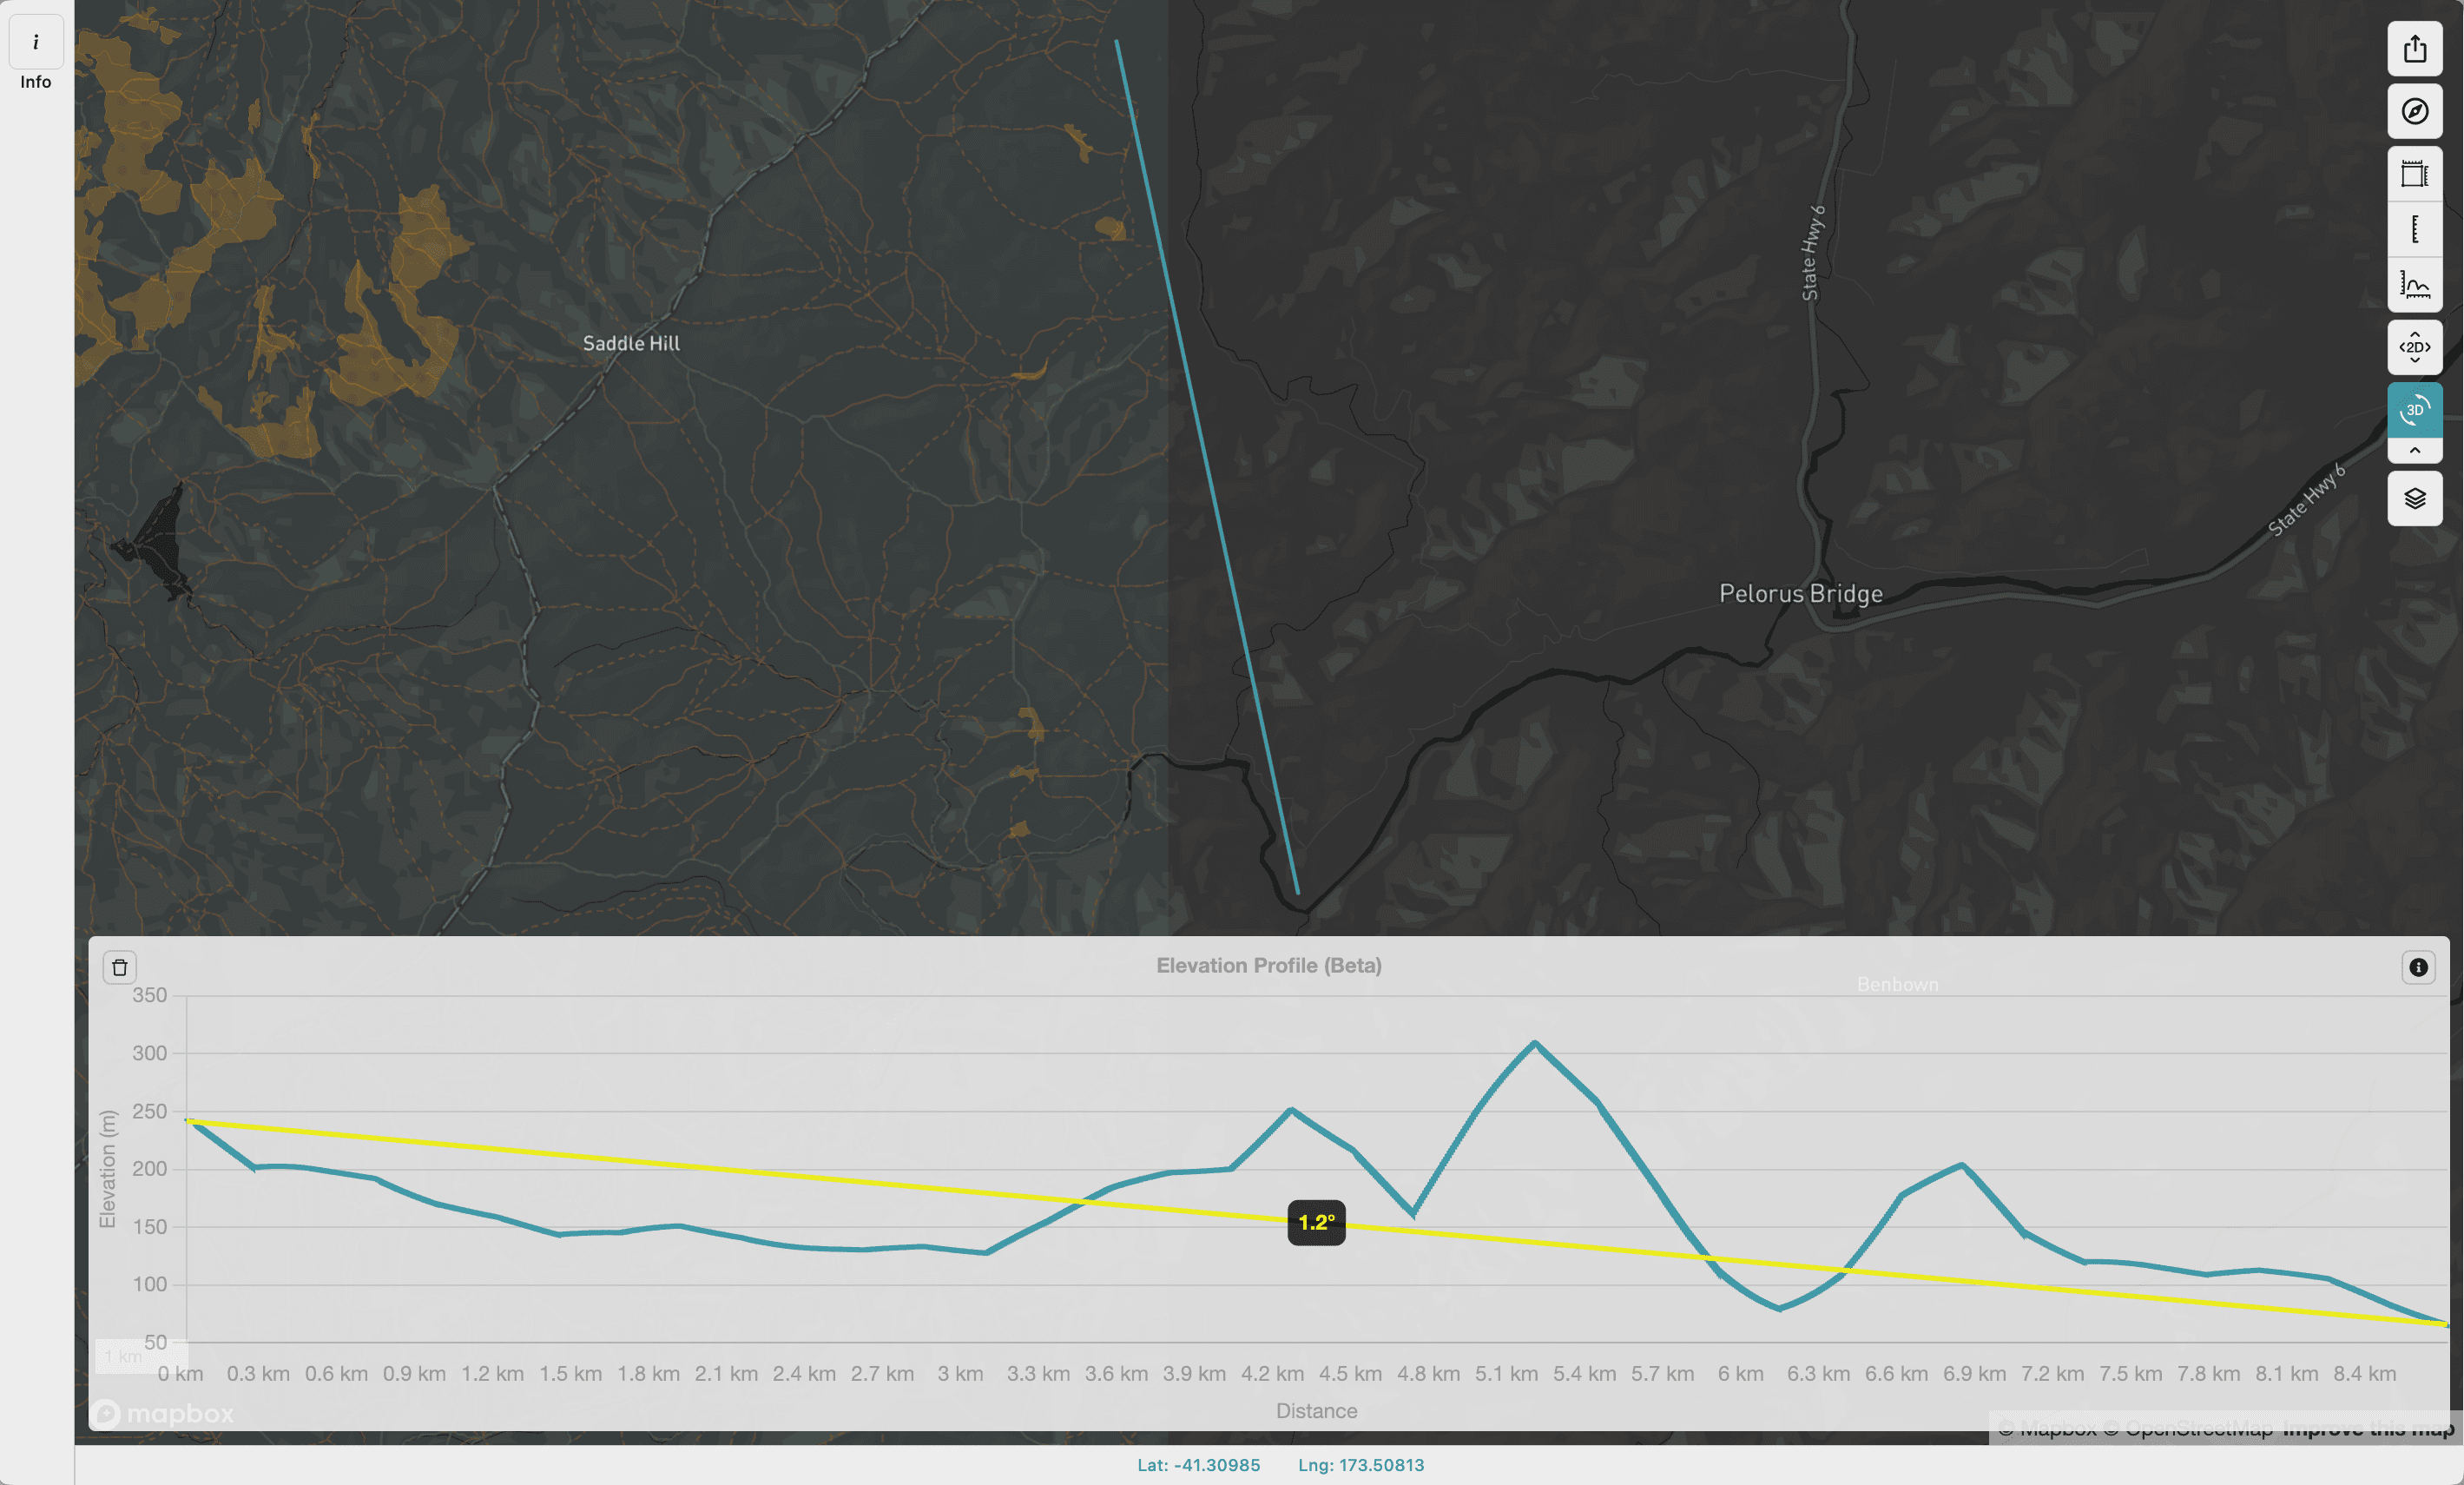
Calculating a Gradient Between Two Points
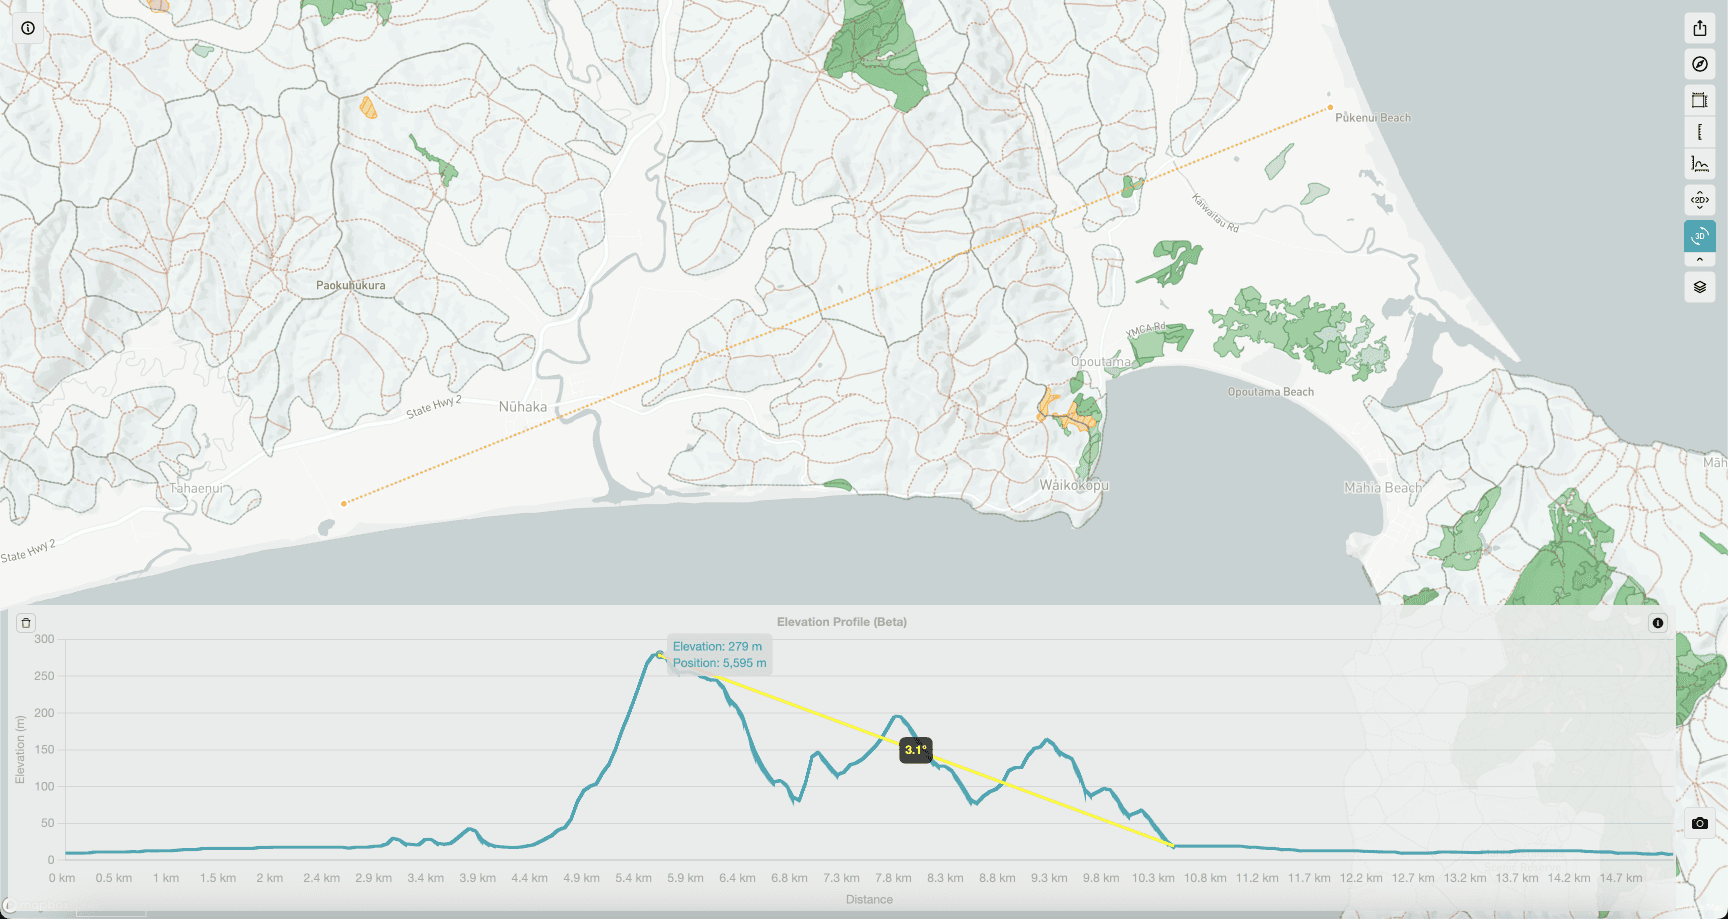
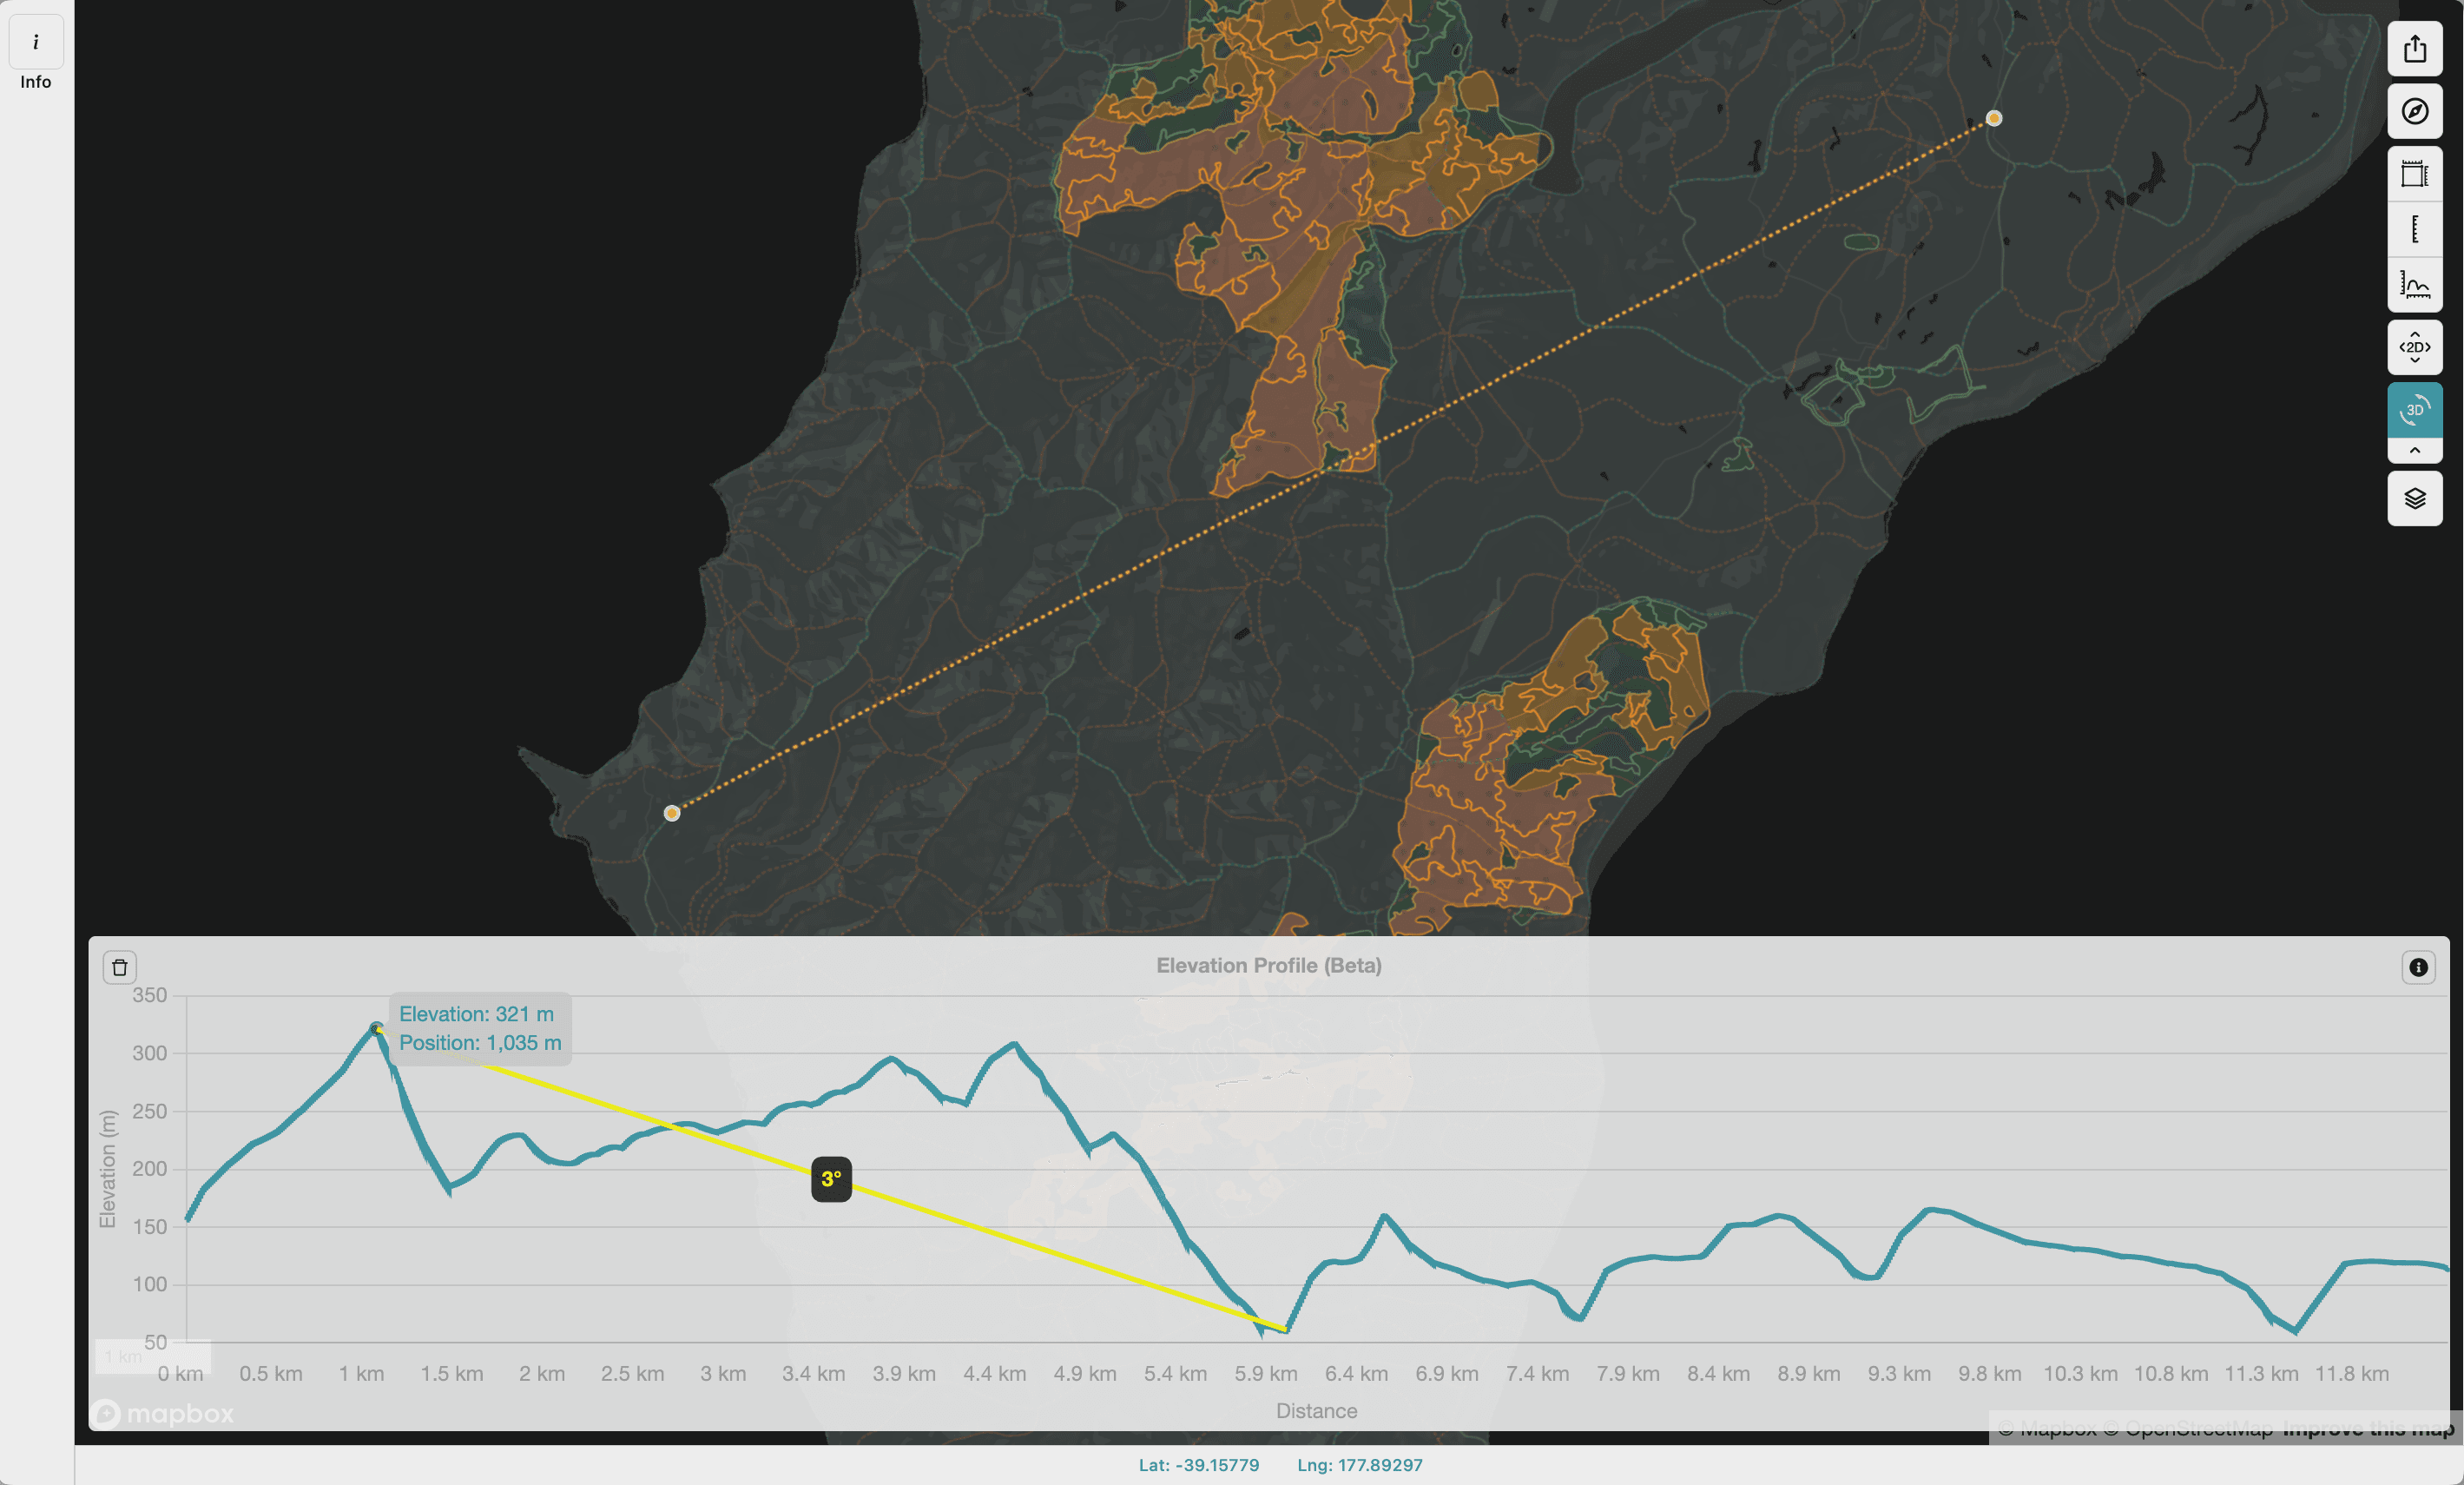
Once you’ve calculated an elevation profile you can also calculate the gradient between two points by clicking any point on the chart to set the first point and clicking another point on the chart will automatically calculate the gradient.